Battery Range vs Payload: Two Halves of One GVW Equation
Battery range and payload on an electric garbage tipper come out of the same gross vehicle weight budget. Every kilogram of cells added to extend range is a kilogram the truck can no longer carry legally. Urban collection work pulls on that budget from both ends at once: short distances and constant stopping change the energy bill and the mass bill together.
Line-haul duty can justify a large pack because distance is the product it sells. Refuse work cannot. Compaction, hoist and hydraulic systems add fixed mass that never leaves the chassis, and whatever is left over is the payload that decides how many bins a round can service before the trip to the transfer station. Fleet engineers who model payload against the axle weight limits early see the constraint in a spreadsheet long before the first vehicle is ordered.
How This Article Is Structured
- Part 1 – Battery range and payload on urban collection routes: how stop density, regenerative recovery, body mass and compaction duty set the working window per shift.
- Part 2 – Components to inspect first in a diesel-to-electric swap: the chassis, axle and body items that fix the weight equation before the battery specification is settled.
Scope: the GVW equation as it applies to urban collection routes, then the first-pass component checks that govern a diesel-to-electric fleet conversion.
Battery Range on Urban Collection Routes: Why the Duty Cycle, Not the Datasheet, Sets the Ceiling
A published battery range figure for an electric garbage compactor truck comes off a steady-state or mixed-duty test cycle: a fixed speed profile, a fixed payload, moderate ambient temperature, and little or no hydraulic work. Urban collection breaks nearly every one of those conditions. The truck rarely passes 30 km/h, stops every 60 to 120 metres, runs the packer and the bin lifter off the same traction battery, and often reaches gross weight before the route is half done. Consumption per kilometre then lands well above the homologated figure, and the state of charge curve falls faster than the sales sheet suggests.
Where the kilowatt-hours actually go
Mass, acceleration cycles and hydraulics account for most of the energy on a collection route. Aerodynamics matter at 80 km/h on a transfer haul and almost not at all at collection speeds. What counts is how often the truck accelerates 12 to 18 tonnes from rest, and how often it drives a pump against a load.
| Energy pathway | Indicative share of route energy | Main sensitivity |
|---|---|---|
| Traction and rolling resistance | roughly 25-35% | Tare weight, tyre pressure, road surface, ambient temperature |
| Stop-start acceleration cycles | roughly 20-30% | Stops per km and gross weight at each pull-away |
| Bin lifter hydraulics | roughly 4-9% | Lifts per route, bin weight and fill, pump efficiency |
| Compaction and packer hydraulics | roughly 10-20% | Compaction ratio, load moisture, packer cycle count |
| Tipping / body hoist | roughly 6-12% | Hoist ram stroke, load mass, lifts per shift |
| Auxiliary loads (HVAC, lighting, cameras, telematics) | roughly 12-20% | Shift length, season, idle time at weighbridge |
These are engineering bands rather than test results, and they overlap at the edges, but the pattern holds across vehicle sizes: hydraulics and stop-start cycles together take a large share of the pack, and neither appears in a typical range certification.
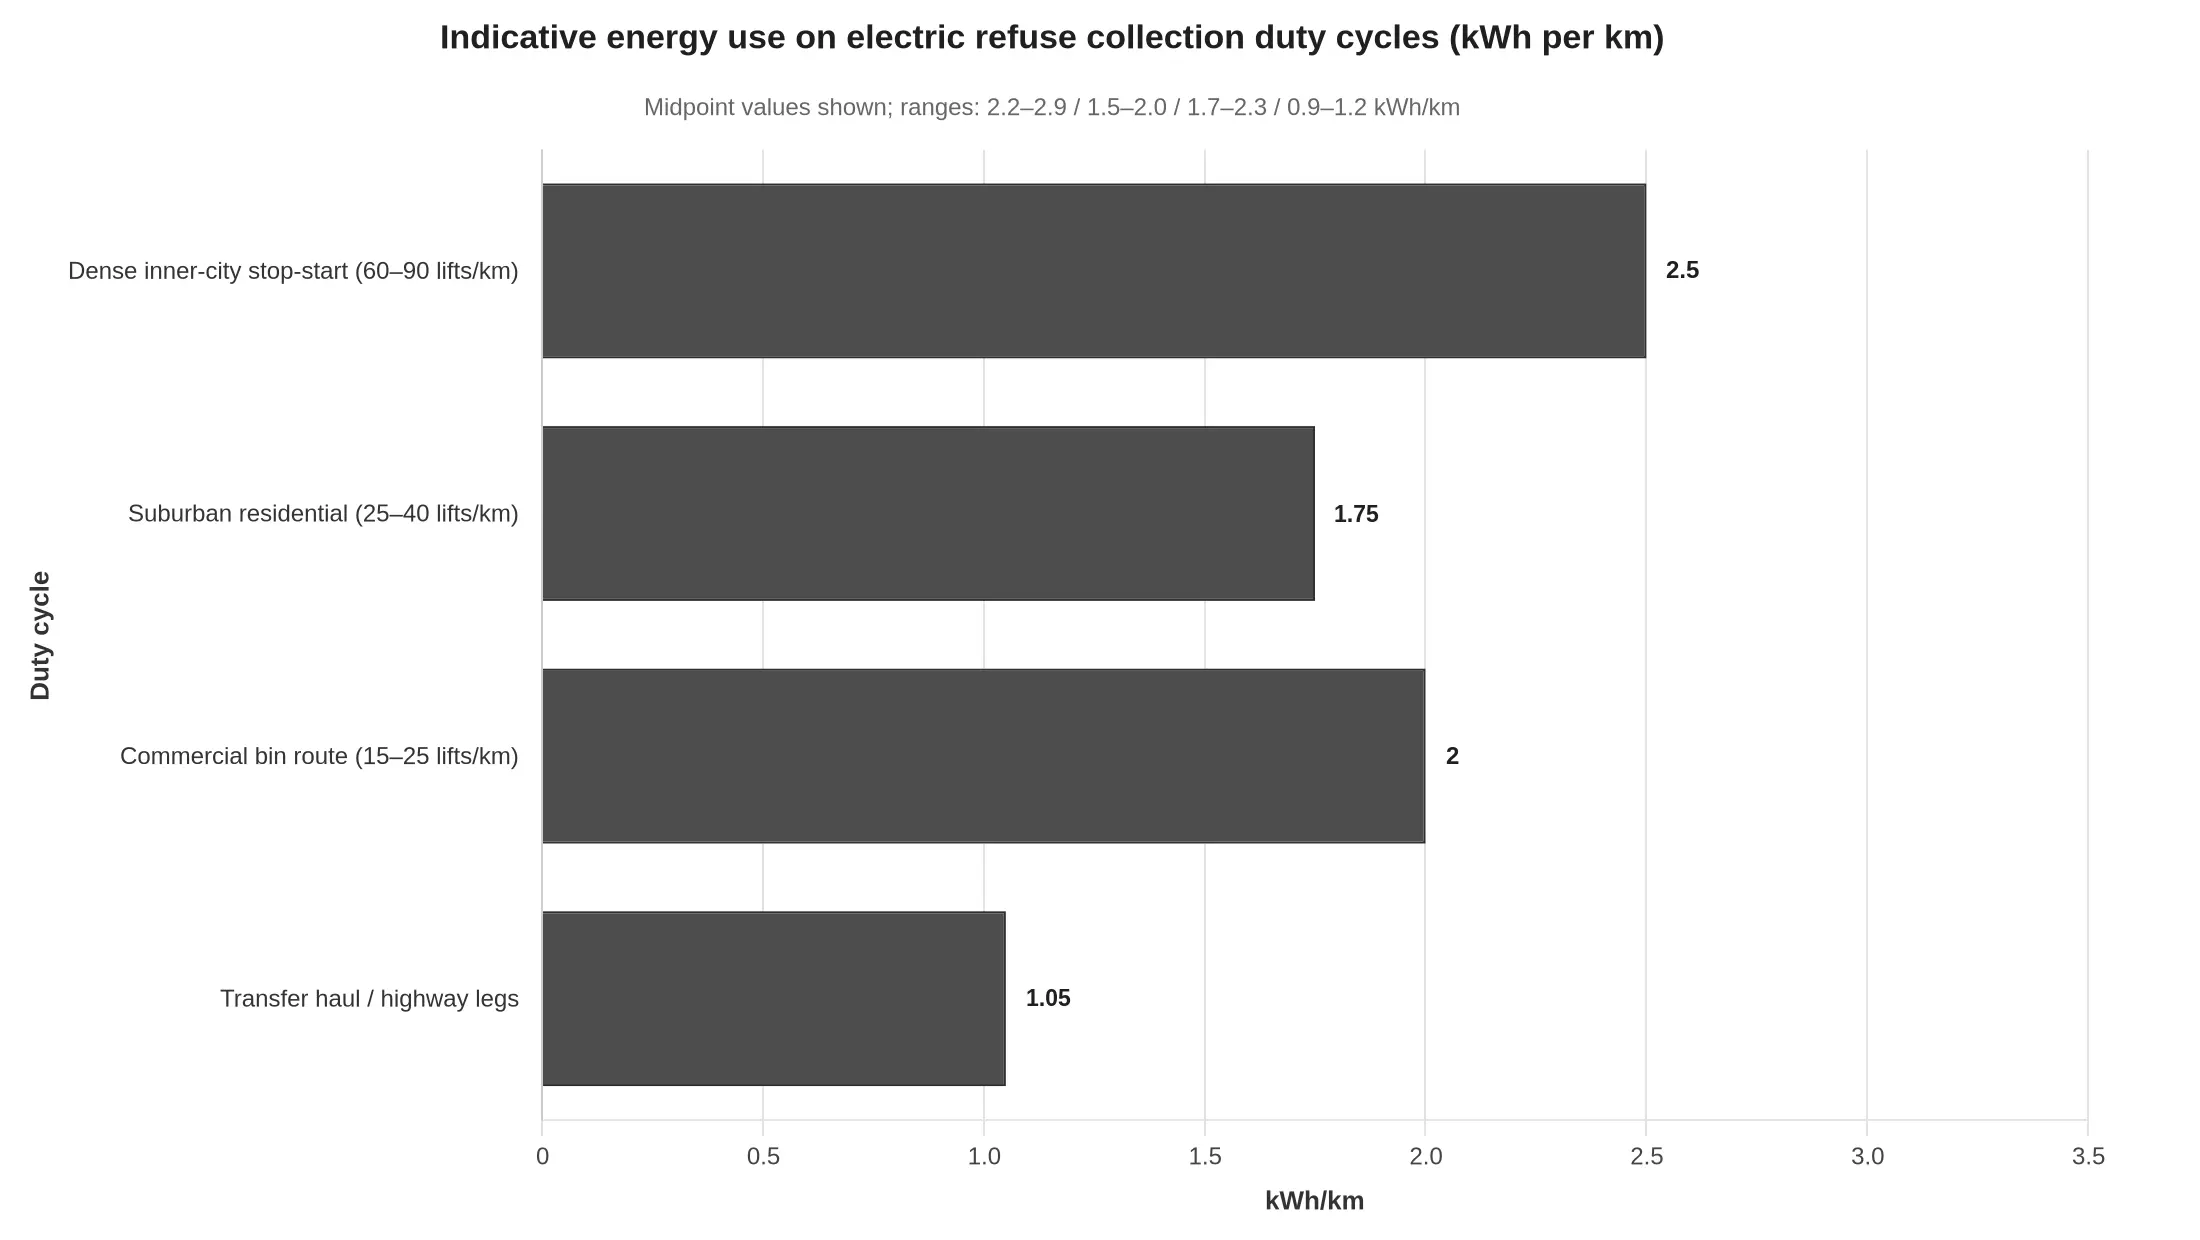
The five duty-cycle variables that move range the most
- Stop-start frequency. A dense round can produce fifteen or more pull-aways per kilometre against five or six on a suburban layout, and every one of them pays the full kinetic-energy bill for the gross mass. Terraced streets with bins on both sides are the worst case.
- Bin lifts per kilometre. Sixty to ninety lifts per km on inner-city rounds against 25 to 40 in suburban layouts. Each lift is a short, high-pressure hydraulic event, and a four-figure lift count across a shift is a measurable kWh cost.
- Compaction work per tonne collected. A wet commercial load with a low effective compaction ratio means more packer strokes for every cubic metre of body volume filled. That figure also sets body size; see what a residential route really packs.
- Tare weight and payload at the moment of acceleration. A heavier empty body and a heavier subframe tax every stop. The motor moves axle mass, whatever the nominal payload says.
- Rolling resistance and route surface. Soft tyres, broken asphalt, gradients and repeated kerb climbing all raise the traction share, and cold mornings raise it further through higher lubricant and hydraulic fluid viscosity.
Regenerative braking: real, but partial at urban speed
Recoverable energy on collection work usually lands in the 10-25% band, nearer the bottom of it. Speeds rarely pass 25-30 km/h, so there is little kinetic energy to recover per stop; stops are short and close together, which leaves little continuous regen window; and a pack that is nearly full or cold will not accept charge at the rate the motor can supply. Much of the shift happens at walking pace on the brake pedal, where regen torque tapers off and the friction brakes do the work.
Why manufacturer range figures must be re-derived
Add those factors up and a defensible planning figure for a dense urban round usually sits 35-55% below the published range, with the gap widening in winter, on hilly terrain, and on days when the truck leaves the yard at gross weight. Treat the brochure number as an upper bound under favourable conditions, then build a consumption model from kWh per kilometre, lifts per route and measured payload. Size the charging window, the route length and the reserve buffer on that re-derived figure.
Range Versus Payload: The Shape of the Trade-Off
The chart below plots achievable range against payload for a typical urban collection route: stop-start running, low average speed, compaction and tipping driven off the PTO, a full shift of hydraulic work. Three pack sizes appear together, and the lines separate as the body fills.
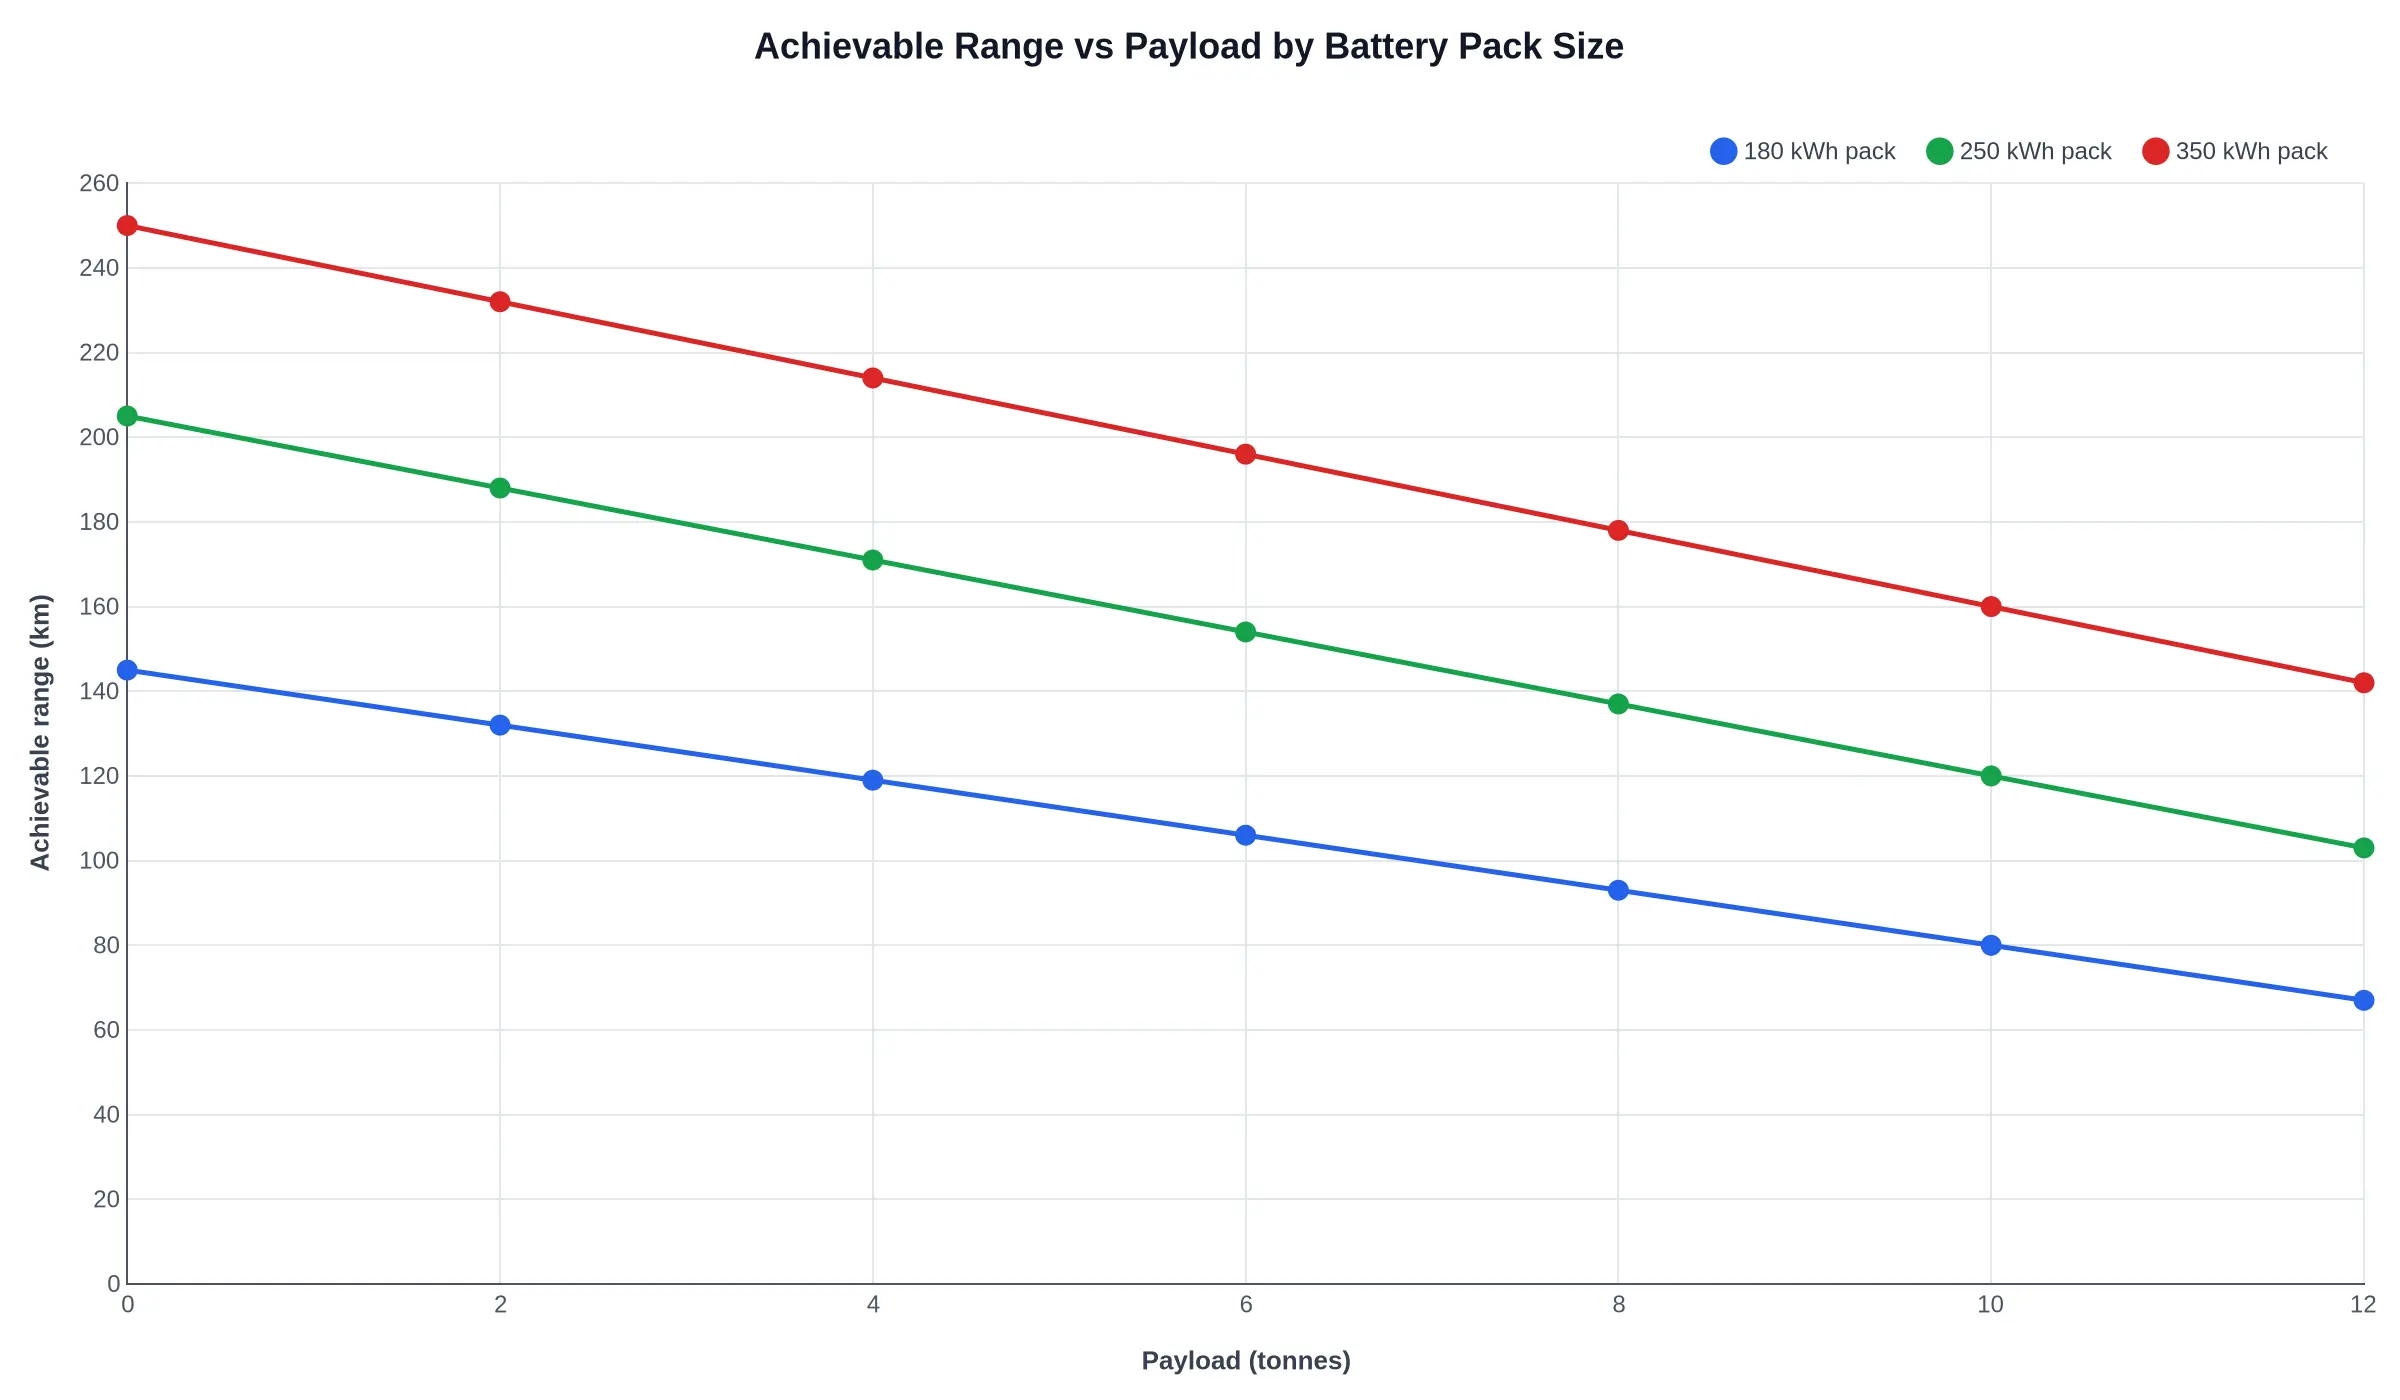
Three points follow from it:
- The slope is close to linear. Each tonne of refuse costs roughly 6.5 km on the 180 kWh pack and about 9 km on the 350 kWh pack, so payload planning is a straight-line subtraction rather than a cliff edge.
- Pack size sets where the curve ends. At zero payload the 350 kWh pack shows 250 km against 145 km for the 180 kWh pack. The gap is still there at 12 tonnes, 142 km against 67 km, which on a working day is the difference between finishing with margin and hunting for a charger at 15:00.
- The small pack loses proportionally more. It gives up about 54% of its range from empty to fully loaded, against 43% for the largest pack. Fixed parasitic loads – compaction hydraulics, HVAC, lights and telematics – take a bigger share of a smaller reserve.
Run the payload arithmetic against real route tonnage and axle limits – which constraint arrives first on a rear-loader – and the vertical distance between these lines decides whether one electric tipper covers a route or whether you need two.
The Payload Math: Gross Vehicle Weight Minus Tare Weight
The arithmetic behind an electric garbage tipper comes down to one line:
Gross vehicle weight (GVW) − tare weight = available payload
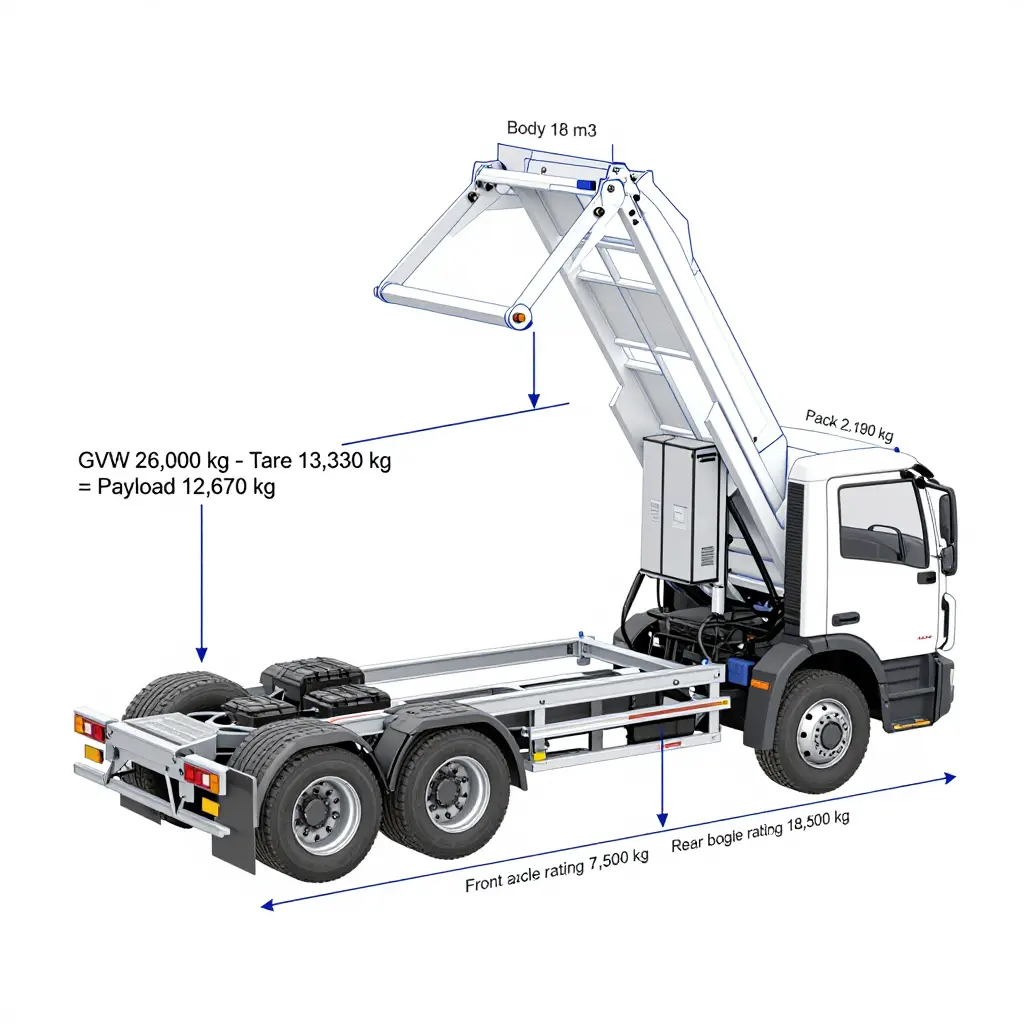
It is simple, and it is where a good number of diesel-to-electric business cases stall. A 26,000 kg GVW 6×4 chassis with a 10,500 kg diesel tare is nominally entitled to 15,500 kg of payload. Electrify the same truck and the tare climbs: not because a battery is uniquely heavy, but because the mass is concentrated, and it arrives with mounting structure, cooling circuits and a heavier driveline attached.
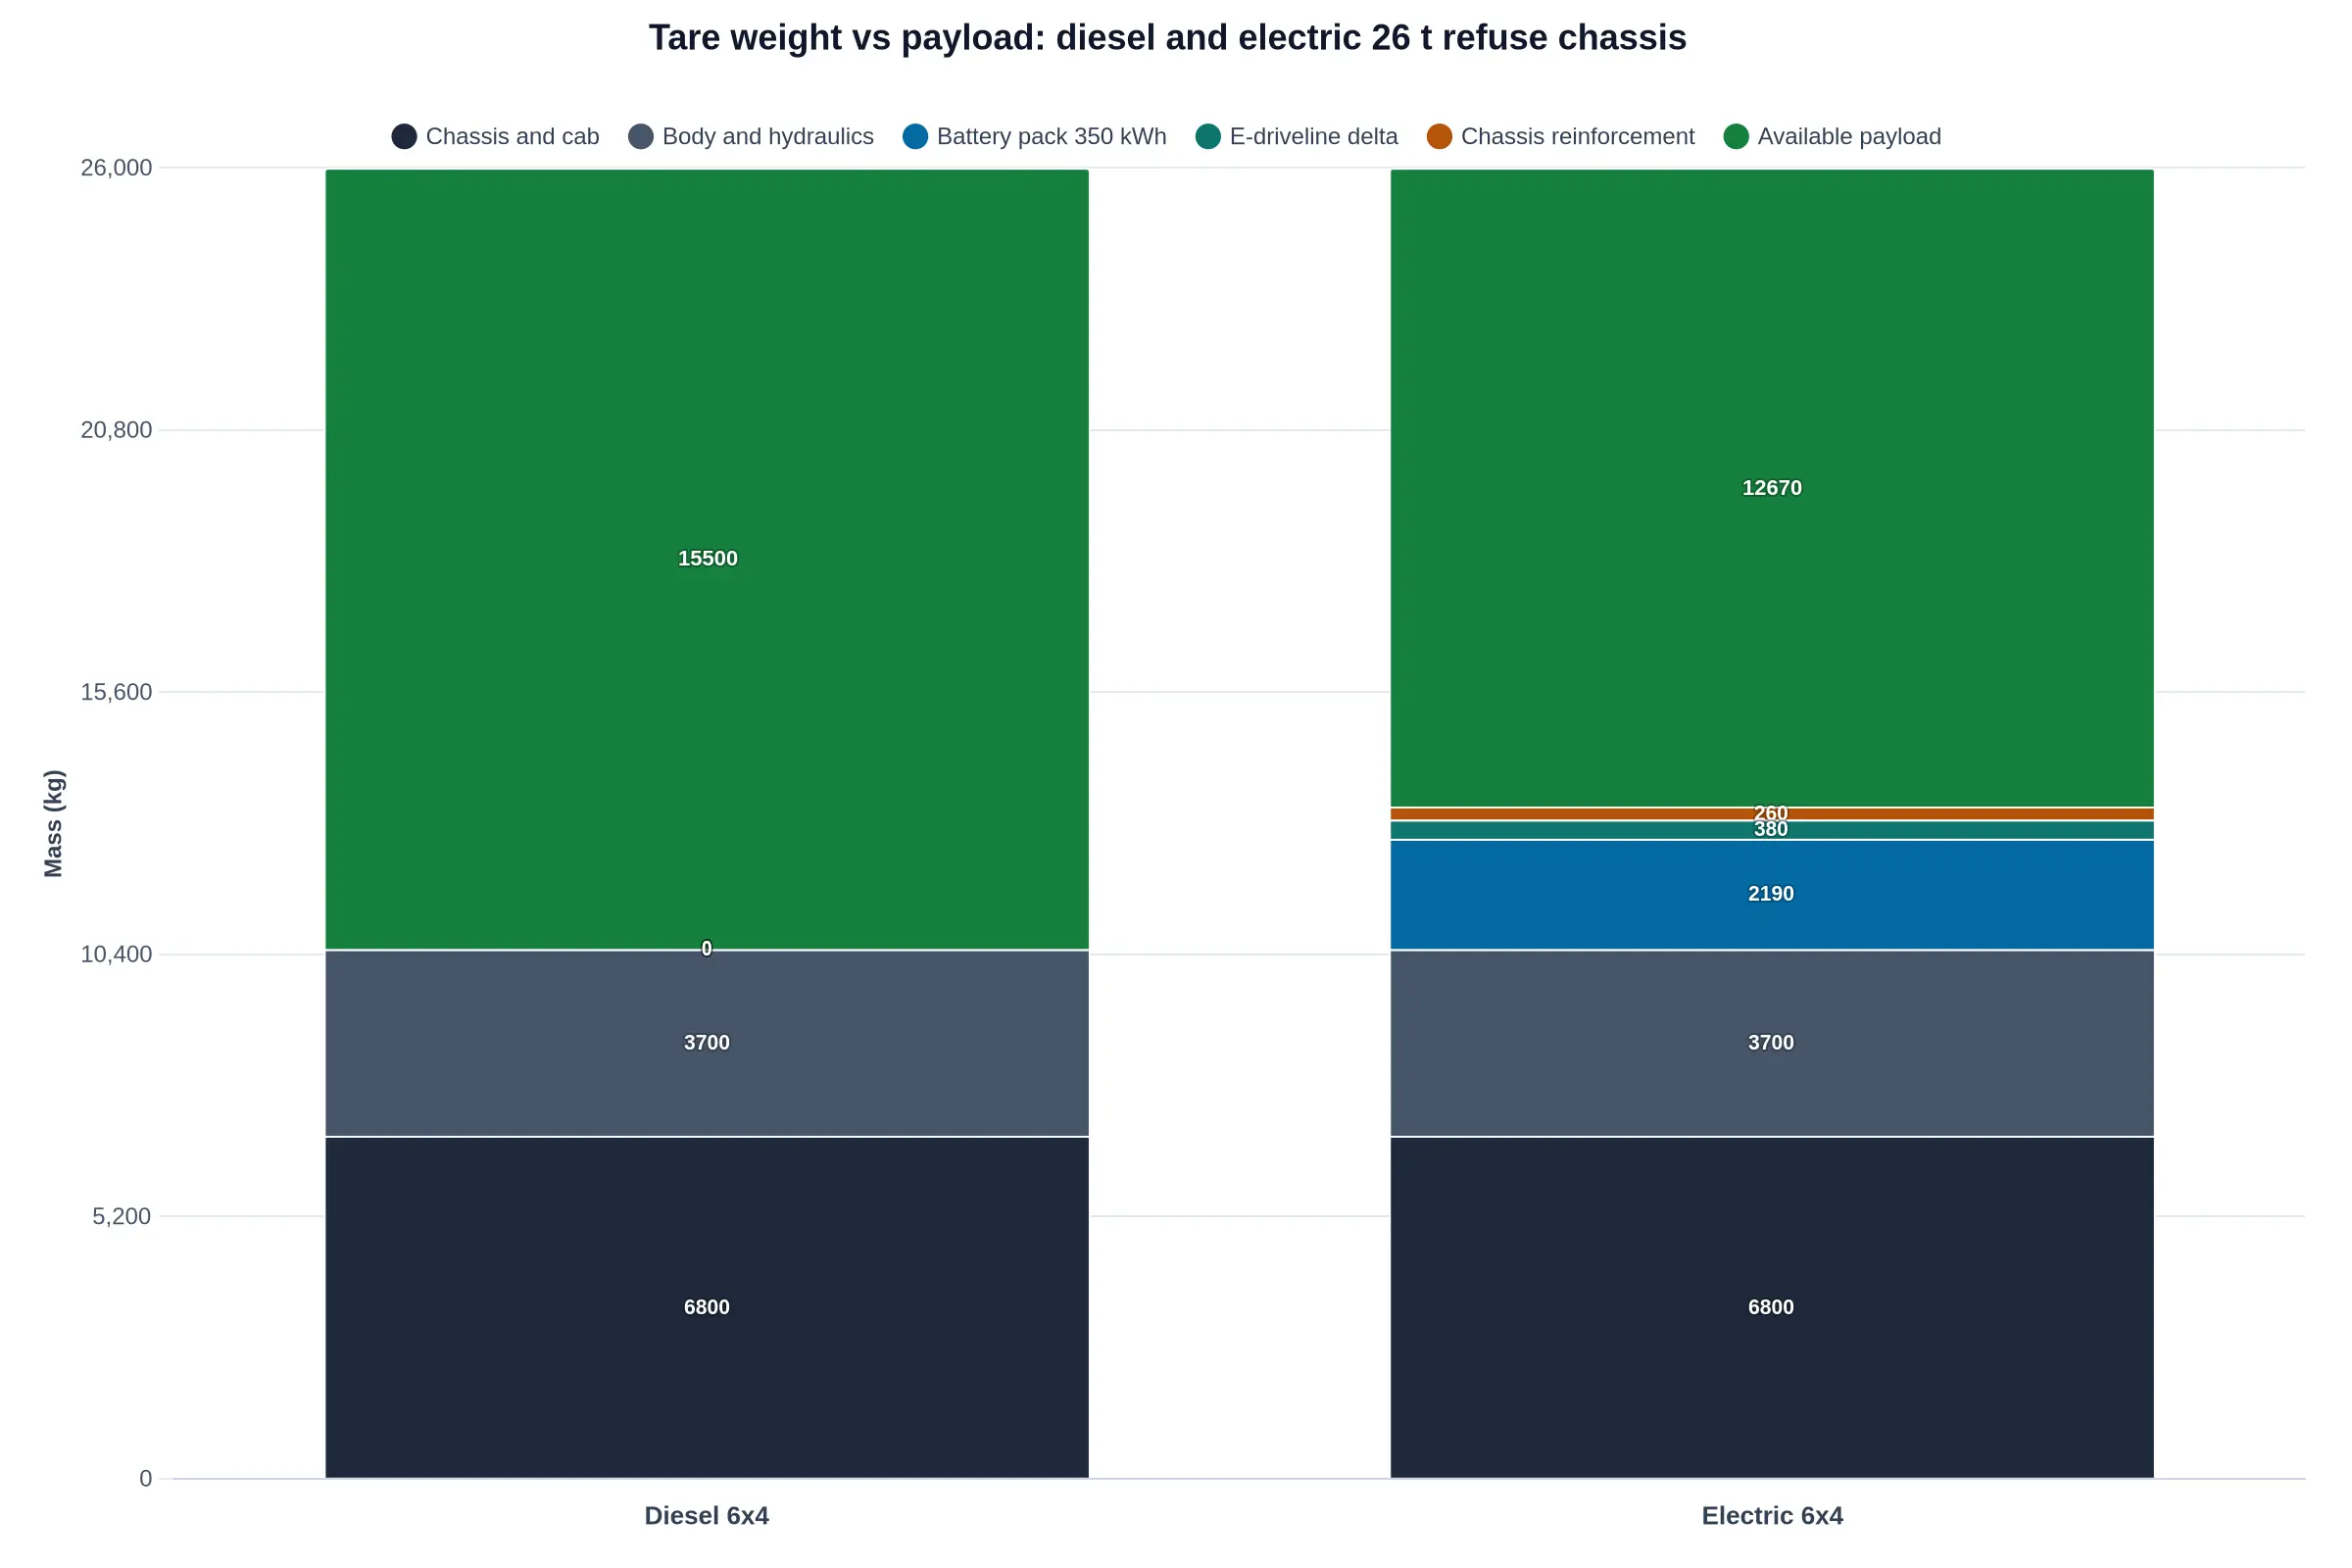
Where the missing tonnes actually come from
The table uses a representative 26-tonne spec with deliberately conservative values: a 350 kWh pack at roughly 160 Wh/kg cell-to-pack, an e-axle and motor package about 380 kg heavier than the diesel driveline it replaces, and 260 kg of pack cradle, crossmember and frame-rail reinforcement.
| Item | Diesel (kg) | Electric (kg) |
|---|---|---|
| Chassis, cab, body, hydraulics | 10,500 | 10,500 |
| Battery pack (350 kWh @ ~160 Wh/kg) | – | 2,190 |
| E-driveline delta (motor, inverter, e-axle) | – | 380 |
| Pack cradle and chassis reinforcement | – | 260 |
| Tare weight | 10,500 | 13,330 |
| Gross vehicle weight | 26,000 | 26,000 |
| Payload by GVW | 15,500 | 12,670 |
A tare penalty of roughly 2.8 tonnes, about 18% of the original payload. Two parameters drive its size, and they are different quantities:
- Gravimetric energy density (Wh/kg) sets the mass you carry. Moving from 160 Wh/kg to 200 Wh/kg on the same 350 kWh removes about 440 kg from the tare – real money on a refuse route.
- Volumetric energy density (Wh/L) sets the space you occupy. A 350 kWh LFP pack at ~270 Wh/L needs around 1.3 m³, while a high-nickel pack at ~450 Wh/L needs closer to 0.78 m³. If the pack will not fit between the frame rails, it moves to a side box or a roof enclosure, which eats body length, raises the centre of gravity, or does both.
Axle load, not GVW, is usually the binding constraint
Payload calculated from gross vehicle weight is a paper figure. The roadside scale weighs each axle, and because a tipper body sits ahead of the rear bogie, roughly 85-90% of anything loaded lands on the rear axle group.
On the diesel example, the front axle carries 4,600 kg against a 7,500 kg rating and the rear bogie 5,900 kg against 18,500 kg. Rear headroom is 12,600 kg, which at an 88% rear share permits about 14,300 kg of legal payload, well short of the 15,500 kg the GVW arithmetic promised. On the electric version the pack splits its added mass roughly 45/55 front-to-rear, putting tare at 5,830 kg front and 7,500 kg rear. Rear headroom falls to 11,000 kg, or about 12,500 kg of legal payload.
The electric truck therefore gives up closer to 1,800 kg of usable payload than the 2,830 kg the tare table suggests, because the front axle absorbs part of the pack. It also leaves the yard with 1,600 kg less rear-axle margin. How that plays out once the body starts compacting is set out in this breakdown of payload versus axle weight and what fills first.
The practical effect on body volume and fill patterns
Payload derating rarely produces a truck that cannot work. It produces a truck whose body never fills. Take an 18 m³ body on wet commercial and mixed workshop waste at about 0.85 t/m³ in-body density, which needs roughly 15,300 kg to fill nose to tail:
| Route mix | In-body density | Mass at full body | Diesel fill level | Electric fill level |
|---|---|---|---|---|
| Loose residential, 2.5:1 compaction | ~0.55 t/m³ | ~9,900 kg | 100% (volume-limited) | 100% (volume-limited) |
| Wet commercial, minimal compaction | ~0.85 t/m³ | ~15,300 kg | 93% | 82% |
| Dense debris / sludge | ~1.05 t/m³ | ~18,900 kg | 76% | 66% |
On a wet-commercial route the diesel is weight-limited at 93% fill; the electric unit reaches its legal axle load with the body about 82% full, a fill line of roughly 1.48 m against a 1.8 m side wall. The packer keeps cycling, the crew keeps tipping bins, and the load cells, if fitted, are the only thing standing between the truck and an overweight departure. Compaction changes as well: once a body fills by mass rather than volume, packer cycles per tonne climb, hydraulic oil runs hotter, and the blade and floor wear faster.
How specifiers compensate
The levers, usually applied together:
- Trim body volume. Dropping from 18 m³ to 15-16 m³ restores a realistic fill margin on dense routes and takes 250-400 kg of body steel out at the same time. Volume that never fills is dead weight.
- Raise axle rating rather than GVW. Uprating the rear bogie and moving to a 7.5 t front axle recovers 1,500-2,000 kg of legal payload where the local weight regime allows it, and is often cheaper than a larger pack.
- Re-plan the route, not the truck. Put electric units on low-density residential rounds where volume fills first, keep wet commercial and debris work on diesel or on a shorter, weighbridge-checked loop, and reduce the tonnes-per-shift assumption in the utilisation model rather than the body size.
An electric garbage tipper rarely fails on carrying capacity. It fails because the specification was written against gross vehicle weight while the officer at the weighbridge reads axle load.
Diesel vs Battery-Electric Garbage Tipper: Side-by-Side Specification Reference
The matrix below is built for procurement and technical evaluation meetings. Values reflect a 6×4 rear-loader class chassis with a 16-18 m³ compaction body, the pairing most municipal fleets compare first. Where payload matters more than volume, how tare weight is calculated on hook lift bodies covers the same ground for that body type.
| Parameter | Diesel Tipper | Battery-Electric Tipper | Practical Implication for Fleet Manager |
|---|---|---|---|
| Tare weight (chassis + body, unladen) | 11,800 kg | 14,200 kg (+2,400 kg battery pack) | Rebalance axle loading; ~20% of gross weight budget consumed before the first bin is lifted |
| Available payload | 10,200 kg | 7,800 kg | Expect 20-25% fewer tonnes per shift; offset with higher compaction ratio or tighter route sequencing |
| Drivetrain | 6-cyl. diesel, 250-300 kW; 6-8 spd AMT; engine PTO | Central e-motor or e-axle, 250-350 kW; 2-spd or direct drive; e-PTO | Similar tractive performance, different torque delivery; spec drivers for one-pedal regen behaviour |
| Energy / fuel capacity | 300 L diesel (~2,970 kWh thermal equivalent) | 280-420 kWh usable LFP pack | Depot charging capacity, not tank size, becomes the route-planning constraint |
| Typical route range | 550-700 km per tank | 140-200 km per charge (stop-go duty, compaction active) | One full shift plus partial top-up; confirm charger availability before tendering |
| Compaction PTO drive method | Engine-driven PTO at 1,000-1,500 rpm; 40-60 L/min pump | Electric PTO via HV inverter and motor, 20-30 kW; load-sensing pump | No idle burn during compaction; compactor cycles quieter and hydraulics respond faster |
| Auxiliary power supply | 24 V alternator, 100-150 A, belt-driven | 24 V DC-DC converter, 3-5 kW, fed from HV pack | No belt or alternator service, but converter thermal management enters the PM checklist |
| Service brake energy recovery | None (engine brake / retarder only) | Regenerative braking, 60-120 kW recovery, blended with friction | 10-25% energy returned on stop-dense urban routes; friction brake life extends significantly |
| Noise output | 78-84 dB(A) drive-by; 85-90 dB(A) at PTO | 62-68 dB(A) drive-by; 66-72 dB(A) at compactor | Opens early-morning and night collection windows in noise-sensitive districts |
| Maintenance touchpoints | Engine oil and filters, EGR/DPF, PTO clutch, belt drive | HV battery coolant loop, e-motor bearings, inverter, DC-DC converter | Fewer fluid services, but HV technician certification and diagnostic tooling become mandatory |
Note: all figures are indicative and vary by body configuration, chassis GVW rating, compactor make and model, battery chemistry, and route terrain.
Available payload and typical route range carry most tender reviews. Where a round fits a single shift with a depot charge window, quieter operation and longer brake life usually outweigh the tare penalty. Where rounds are long, dense or split across depots, a mixed fleet works better, with the electric units on the stop-heavy urban cores where regeneration pays back fastest.
Write the numbers into the tender document early, then hold suppliers to them with a weighed, loaded demonstration on a representative route. A datasheet figure and a scale reading at 06:00 with a full body are rarely the same number.
The First Components to Check When Swapping a Diesel Fleet
Converting a diesel fleet to battery-electric power is not a truck-for-truck swap. The energy source changes and the duty cycle does not: the body still gets slammed, the hoist still lifts a wet load on a cambered street, and the packer still cycles thousands of times a week. So the transition has to run as a component audit, and the useful question is not which electric chassis to buy but which parts of the existing truck will take the load profile of an electric garbage tipper and which will fail in year two.
Work through the list in order. Each item says what to verify and why it decides whether the conversion pays back.
-
Chassis frame rails and subframe – corrosion and cracking. Walk the full rail length, paying attention to the section behind the cab, around the hoist pivot brackets and every crossmember gusset. Use dye penetrant on weld toes and check for rust scale inside the C-channel. Battery packs add concentrated point mass the diesel layout never carried, and hairline cracks propagate faster once the mass distribution shifts.
-
PTO and hydraulic pump drive arrangement. On a diesel truck the PTO is typically engine-driven; an electric chassis has no idling engine to spin it, so you must confirm whether the body runs on an e-PTO, a belt-driven hydraulic pump off an accessory drive, or a dedicated electric motor-pump unit. Verify mounting interface, spline condition, pump displacement and relief settings, and pull the PTO hours log – that figure, not odometer mileage, is the true wear clock on the pump and the valve block.
-
Hydraulic oil cooling capacity. There is no engine fan at standstill on an EV, and packer or tipper circuits run continuously at low road speed. Verify cooler size, airflow path, fan power draw and thermal margin at a 35 °C ambient during back-to-back cycles. Undersized cooling turns into oil degradation, seal failure and slow lift times within a single summer.
-
Body floor and hopper plate thickness. Take ultrasonic thickness readings on a grid across the floor, the hopper plate and the lower side walls, and compare them against the original spec. A plate that has lost 30 percent of its section will not tolerate the extra compaction cycles a quieter EV body encourages. Combine it with the packer blade and body wear checks before the body goes onto a new chassis.
-
Lift cylinder and hinge pin wear. Measure pin and bush clearance at the hinge, inspect chrome for scoring and check cylinder rod straightness and seal weep. Worn pins tilt the body and side-load the cylinder, and that damage accelerates on an EV because the lift can be operated more often per shift.
-
Axle ratings and suspension. Confirm front and rear GAWR, spring or airbag rating and actual laden weight distribution with the new battery mass. A conversion that keeps the body and overloads the rear axle is a compliance failure, whatever the range figure says.
-
Brake and air system compatibility. Regenerative braking changes friction brake duty and heat cycles, while air-actuated body and hoist controls still need a reliable compressor and dryer. Verify compressor duty cycle, air dryer capacity, ABS/EBS signal compatibility and reservoir sizing for repeated packer cycles.
-
12/24V auxiliary loads and DC-DC conversion. Audit every DC consumer – body controller, work lights, beacons, camera, tarpaulin motor, valve solenoids – and size the DC-DC converter with real headroom, not nameplate sums. Confirm the body’s 24V circuits are fed by a converter rated for continuous load, otherwise voltage sag will show up as lazy hydraulics and nuisance faults.
-
Telematics and CAN integration. Check that the body controller can talk to the chassis over J1939, that safety interlocks (park brake, neutral, body-down) are wired correctly, and that route telematics can pull state-of-charge, payload and fault codes into one dashboard.
-
Workshop tooling and technician competence. Inventory insulated tools, CAT III/IV meters, high-voltage gloves, lockout-tagout kits and charger diagnostics, then confirm who is certified to work on the HV system. Your hydraulic and body technicians already hold half the skill set – the gap is electrical safety training and documented procedures.
Run the audit before the purchase order, not after delivery. A truck that passes all ten checks is a conversion candidate; one that fails three or four is usually cheaper to replace outright.
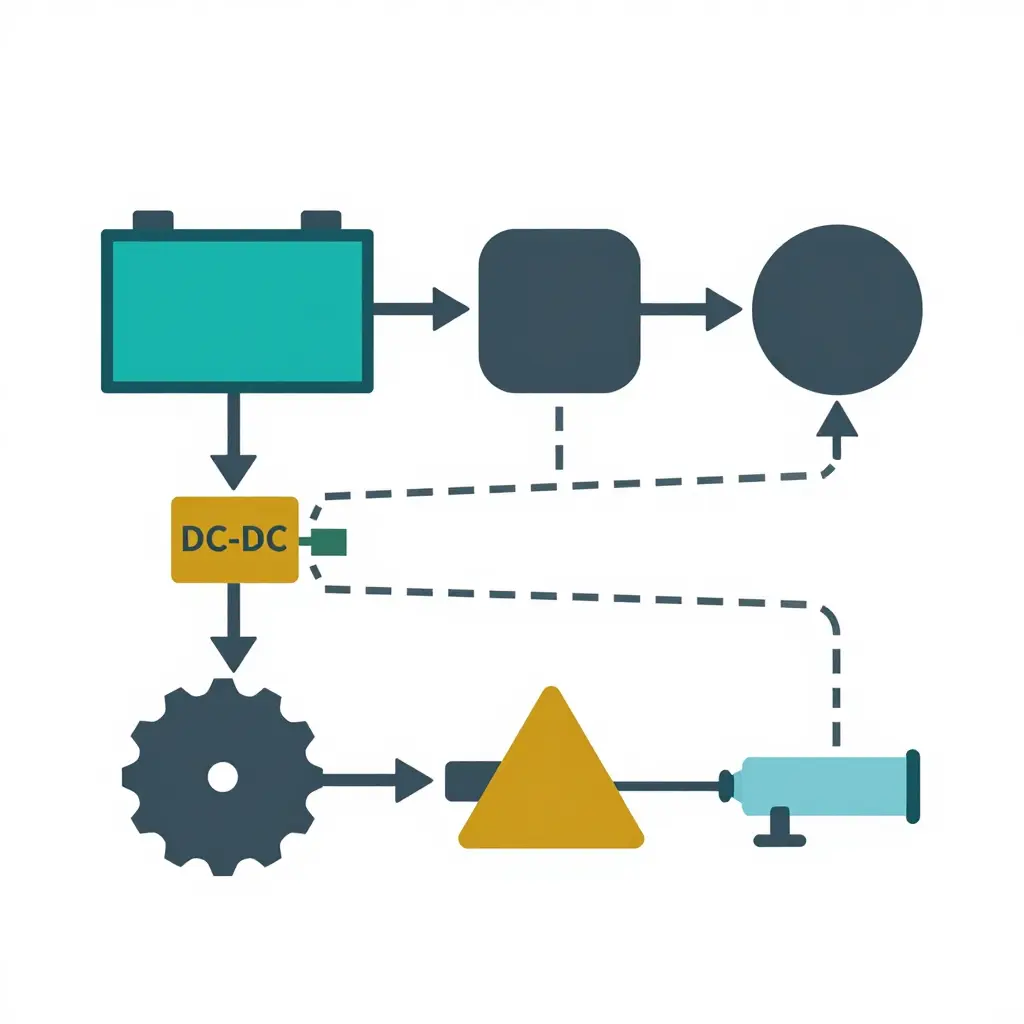
Figure 1 – Simplified energy-flow split on an electric refuse tipper: traction layer (top) versus body-hydraulic and auxiliary layer (bottom).
Reading the diagram
An electric garbage tipper carries two very different loads off one pack.
- Traction layer (top path): the battery pack feeds the traction inverter, which converts DC to three-phase AC for the motor. This is the energy that moves mass along the route, so it scales with payload, grade, and stop-start frequency.
- Body-hydraulic layer (bottom path): a dedicated power take-off path drives the hydraulic pump that pressurises the compaction circuit and the tipping ram. Packer cycles and lift-tip events draw high current in short bursts, largely independent of road speed.
- Auxiliary layer: a DC-DC converter steps pack voltage down to run cab HVAC, lighting, telematics, cameras, and body control electronics – a small but constant parasitic draw across a full shift.
A route that looks fine on paper can still strand a truck because of this split: traction energy follows the duty cycle, while body-hydraulic energy follows how often the packer strokes and how many bins get tipped. On diesel trucks the equivalent habit is tracking PTO hours and hydraulic pump wear before you bid; on an electric chassis, that same PTO-hour logic becomes a kWh budget line.
The components below decide most often whether a converted fleet meets its promised range and payload.
PTO and Hydraulic Circuit Checks: Where the Drivetrain Diagram Meets the Workshop Floor
A drivetrain diagram earns its place only if it changes what a technician does with a wrench. On an electric garbage tipper the hydraulic side is where that happens: the body, packer and tipper have not changed, but the way they are driven has.
Electric PTO versus engine-driven PTO
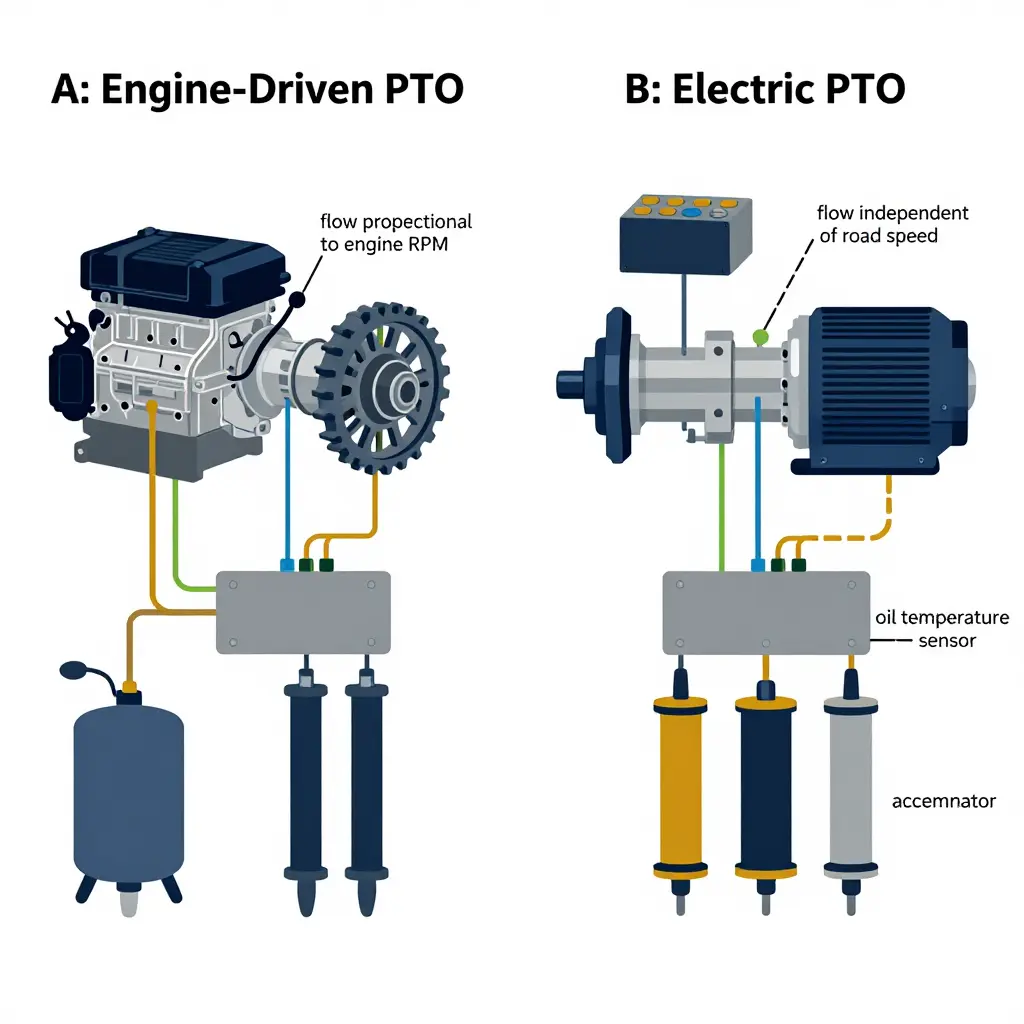
An engine-driven PTO takes power off the flywheel or a transmission power take-off, so hydraulic output is tied to engine speed. At a stop-start kerbside collection, the engine idles while the packer works, and pump speed falls with it. An electric PTO decouples the two: a dedicated motor spins the hydraulic pump at a fixed, optimal speed regardless of road speed or engine state, and can be commanded on only for the seconds a stroke actually needs.
Flow then becomes repeatable, so cycle times no longer drift between a cold morning and a hot afternoon. And every PTO hour comes out of the traction battery, which is why the e-PTO logic should shut the pump down between strokes rather than run it continuously.
Pump displacement and flow matching
Do not carry the diesel pump over by habit. Size the displacement to the cylinder volume and the cycle time the route actually demands – rural routes with light, dry loads behave very differently from dense commercial waste, and the relationship between route tonnage and compaction demand should set the flow target before the pump is specified. The e-motor must also deliver enough torque at the chosen speed to hold relief pressure at full displacement.
| Pump displacement | Pump speed | Theoretical flow | Typical full compaction cycle |
|---|---|---|---|
| 45 cc/rev | 1400 rpm | 63 L/min | ~14 s |
| 56 cc/rev | 1500 rpm | 84 L/min | ~12 s |
| 71 cc/rev | 1500 rpm | 107 L/min | ~10 s |
| 80 cc/rev | 1600 rpm | 128 L/min | ~9 s (verify line and valve sizing) |
Undersizing the pump stretches the compaction cycle and lets the packer stall mid-stroke; oversizing it adds heat, noise and battery draw for a speed gain the crew never notices.
Oil temperature when compaction runs at walking pace
Hydraulic oil temperature is where electrification most often goes wrong. A collection truck spends most of its shift at 8-12 km/h with the packer cycling every few hundred metres. Airflow over the tank and cooler is minimal, and an engine-driven PTO at idle delivers low flow with high pressure drop – energy that becomes heat rather than work.
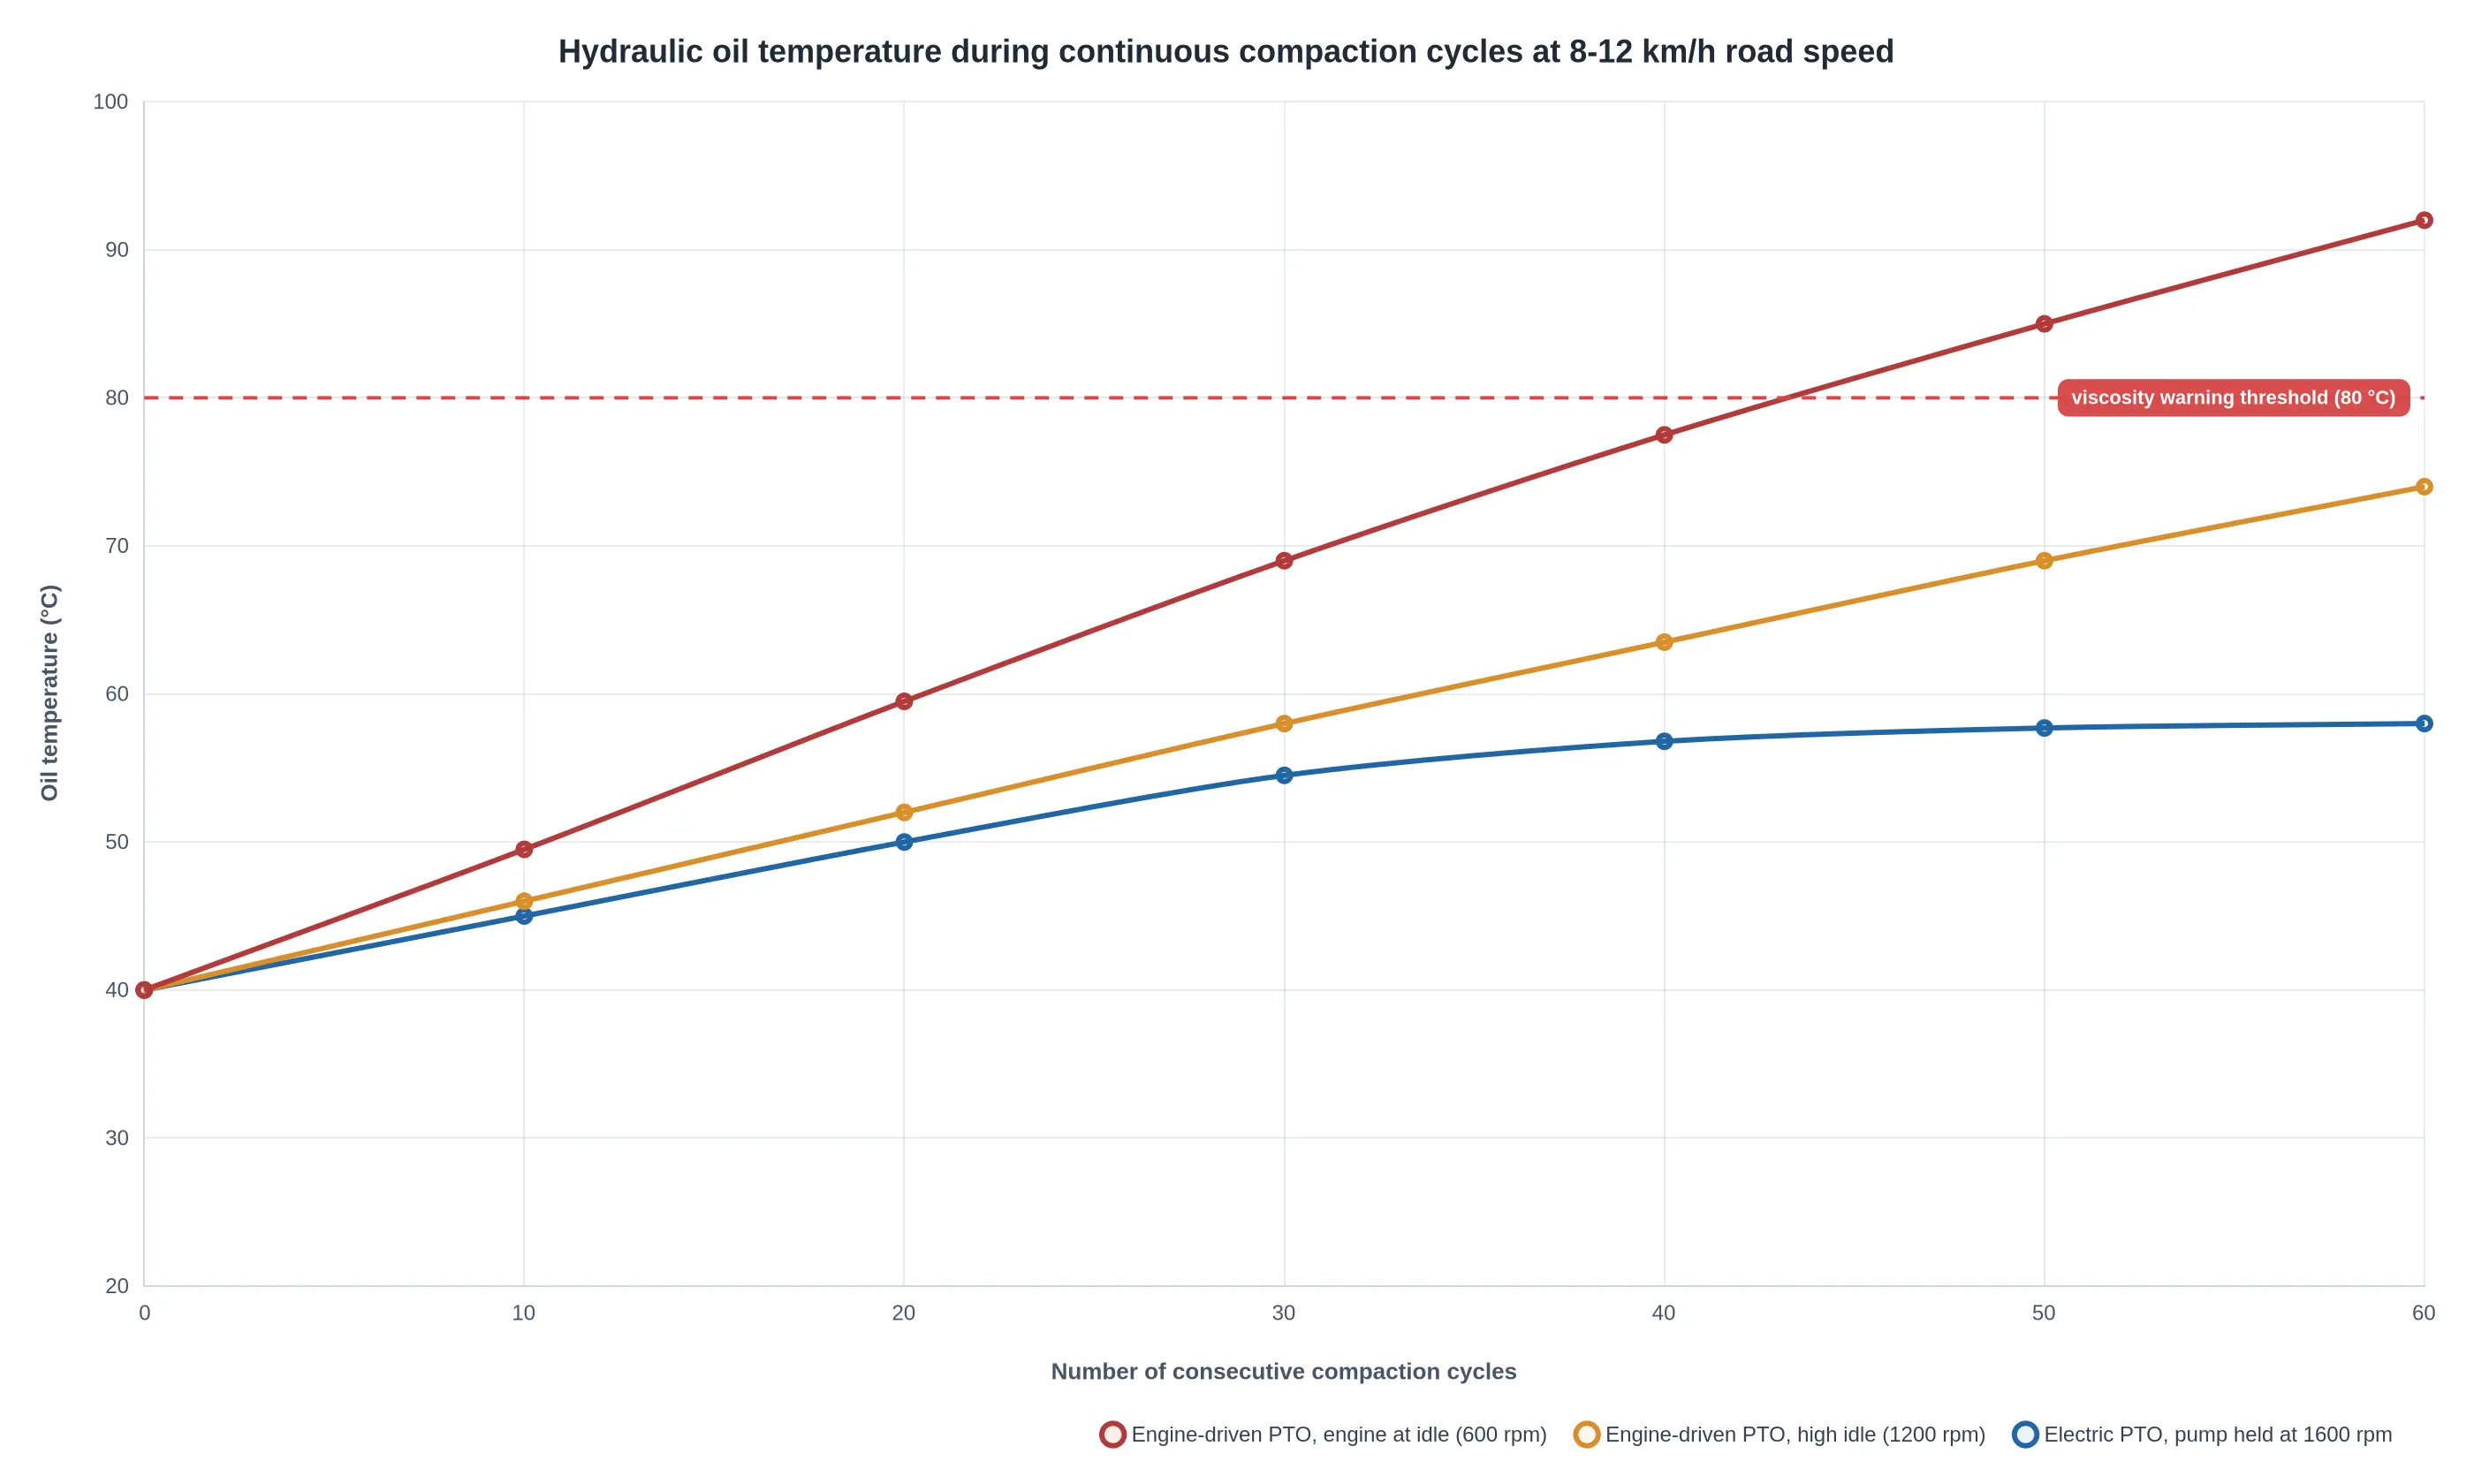
An electric PTO holds the pump at a speed where volumetric efficiency is good and internal leakage is low, so oil temperature reaches a stable plateau instead of climbing toward the 80 °C viscosity warning threshold. Fit a temperature sender wired to a derate strategy, not only a dash gauge.
Accumulator and pressure-hold behaviour
If the circuit uses an accumulator for fast packer return or to hold the tailgate, the pre-charge must be checked against the new pump’s pressure curve. An e-PTO that shuts off instantly can leave a circuit that bleeds down faster than the diesel version did, and a creeping cylinder shows up as a blade that will not stay seated.
What high PTO hours on a donor body reveal
When a used diesel body is transplanted, the hour meter is a wear report. High PTO hours with modest mileage means the pump has run hot and long: expect scored valve spools, tired relief cartridges, glazed hose liners and a suction strainer packed with debris. Pressure-test at the valve block, not at the pump outlet – the difference tells you whether the loss is the pump or the circuit.
Three checks before the body goes onto the new chassis:
- Verify flow and pressure at the valve block across the full stroke of the packer and tipper cylinders.
- Log oil temperature over 20 consecutive compaction cycles at low road speed and compare against the plateau you expect.
- Inspect the pump drive coupling, suction line and accumulator pre-charge for wear carried over from the diesel life.
Onboard Energy Split by System: Where the Kilometres Actually Go
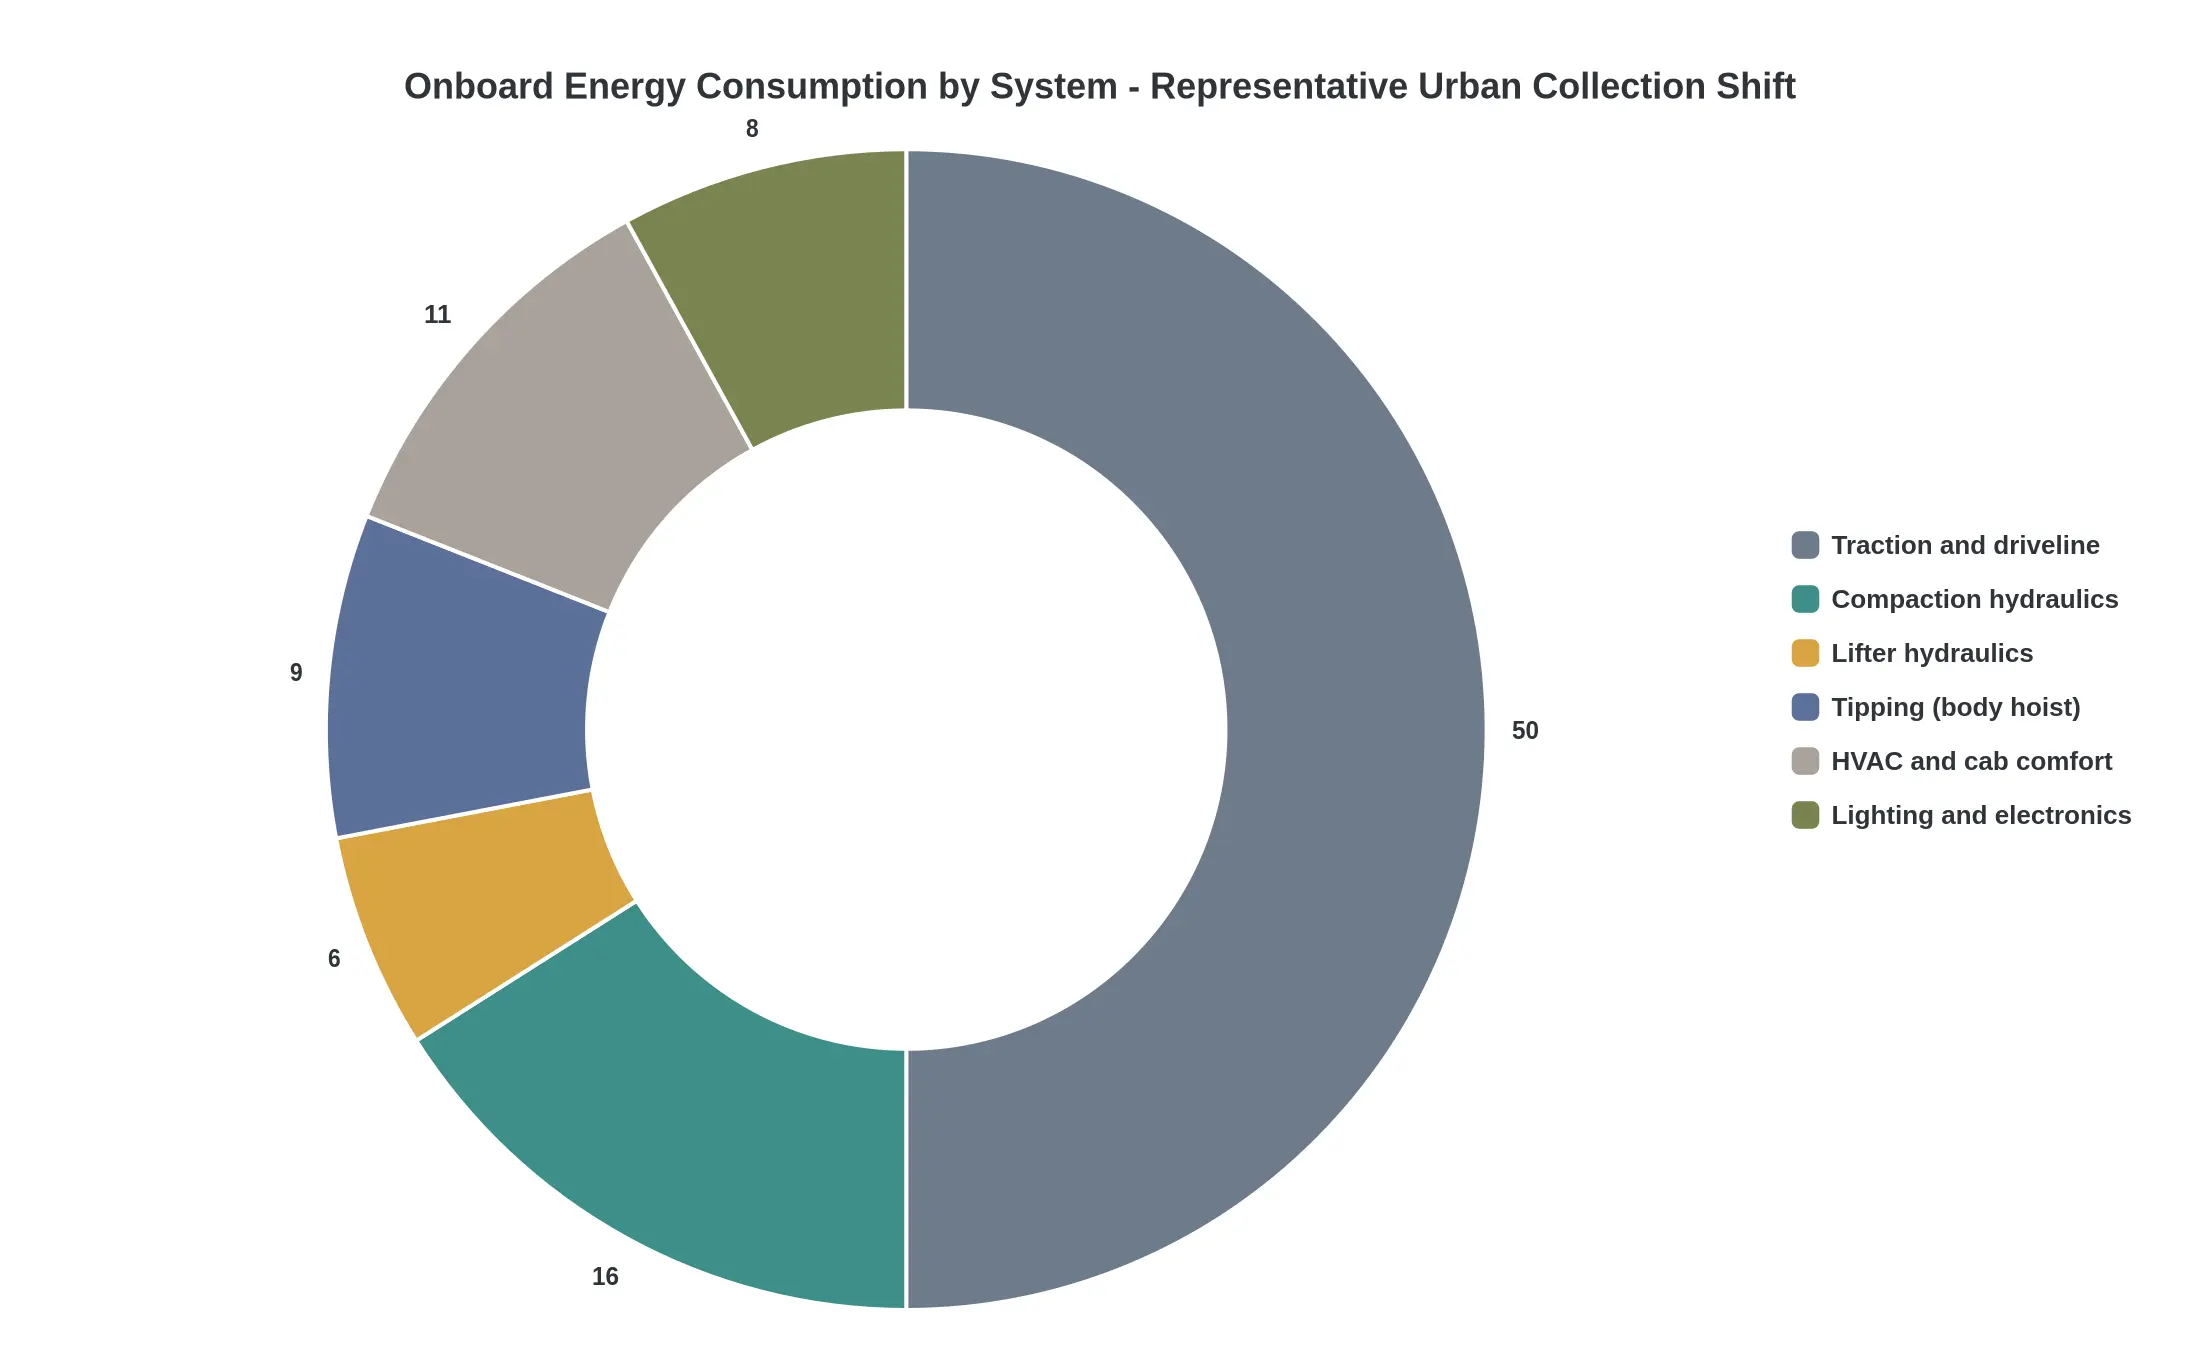
Comparisons of electric and diesel refuse tippers usually start with traction. Traction is the largest single load, but on a collection route it is not even a comfortable majority. The chart below breaks down a representative urban shift by system demand.
The figures are approximate shares of total onboard energy drawn from the pack over a mixed urban shift: several hundred stops, 60 to 90 km of stop-start driving, compaction running between stops, and a body tip at the transfer station.
Reading the slices
- Traction and driveline (about 50%). Still dominant, but note what it responds to: mass, rolling resistance and regenerative braking efficiency. Payload and route hilliness move this number directly.
- Compaction hydraulics (about 16%). The packer strokes all shift, not once at the end. The load scales with stop count and with material density, and a wet commercial bin route raises it sharply, so route tonnage decisions carry an energy cost as well as a legal one.
- Lifter hydraulics (about 6%). Small per lift, cumulative over hundreds of bin presentations. This is the load that punishes manual over-revving habits and worn pump components.
- Tipping / body hoist (about 9%). One or two lifts per shift, each drawing a hard instantaneous current that matters for battery thermal behaviour and for sizing the DC-DC and hydraulic power take-off arrangement.
- HVAC and cab comfort (about 11%). Often underestimated in temperate climates and badly underestimated elsewhere. A two- or three-person crew with doors opening at every stop, plus defrost and demist duty on early shifts, runs the compressor far more hours than a line-haul truck would.
- Lighting and electronics (about 8%). Beacons, work lights, camera systems, reversing alarms, telematics, body control modules and the crew’s own device charging. It is the least negotiable slice, and the one that eats usable range in winter.
Why this changes the range-versus-payload maths
Roughly half of the energy budget goes to systems that do not care how far the truck travels; they care how many times it stops, lifts, packs and tips. That is the core of the payload trade-off. Adding 500 kg of body or payload raises traction demand, but the auxiliary load stays pinned to route duty. On short, dense inner-city rounds with high stop counts, the non-traction share can climb above the figures shown here, and the energy-per-tonne-km curve degrades faster than a simple mass calculation predicts.
| System | Share of shift energy | Primary driver | Frequency on route |
|---|---|---|---|
| Traction and driveline | ~50% | Mass, grade, rolling resistance, regen capture | Continuous |
| Compaction hydraulics | ~16% | Packer cycles, material density | Every stop |
| Tipping (body hoist) | ~9% | Hoist ram stroke, load mass | 1-2 per shift |
| HVAC and cab comfort | ~11% | Ambient temperature, door openings | Continuous |
| Lighting and electronics | ~8% | Beacons, cameras, telematics | Continuous |
| Lifter hydraulics | ~6% | Bin presentations, pump condition | Every bin |
Practical implications for a diesel-to-electric swap
- Size the battery against route duty, not just kilometres. A 70 km route with several hundred stops is not equivalent to a 70 km line-haul run.
- Inspect hydraulic pump and PTO components during conversion. Wear that was invisible under a diesel’s surplus idle power becomes a measurable range penalty on a battery-electric driveline.
- Ask for per-system energy logs from the supplier’s pilot vehicles. Aggregate range figures hide the auxiliary load profile that decides whether a route finishes on one charge.
- Train crews on stop discipline. Each unnecessary packer cycle comes straight out of the usable range budget.
Traction gets the attention; hydraulics and cab systems decide whether the truck completes the round.
Charging Strategy, Duty Cycle Matching, and Route Scheduling
The range figures above are a starting point, not an operating plan. Once an electric garbage tipper leaves the yard, reachable range becomes a scheduling question: when it charges, how deep it discharges, where the crew pauses, and in what order the bins get emptied. Charging strategy is what turns a usable-kWh number into a route that finishes on time with margin left in the pack.
Usable capacity is not nominal capacity
A pack badged at 400 kWh rarely delivers 400 kWh of work. Expect 90 to 95 percent of that figure to be usable, a low-end buffer against deep discharge, and a state of charge floor the BMS enforces regardless. Plan the duty cycle on usable energy, then subtract a reserve for the return leg, the queue at the transfer station and the body’s own hydraulics.
Depth of discharge policy
A daily band of roughly 30 to 80 percent state of charge keeps a refuse pack in a comfortable regime without stranding the truck. Charging to 90 or 100 percent is reasonable before a heavy double-shift day, but making it the default costs cycle life over a seven-year asset. Write the depth of discharge policy down, sign it off with the battery supplier, and hold drivers to it through telematics alerts rather than goodwill.
Charge rate and pack life
Charge rate is the second lever. Repeated DC fast charging into a warm pack at the end of an afternoon run accelerates the capacity fade that shows up in year four. A practical compromise is moderate DC power during the shift and slower AC charging overnight, when dwell is long and cell temperature has settled. Anything above roughly 80 percent state of charge should be treated as a slow top-up, not a quick hit.
Dwell windows matter more than charger size
Opportunity charging only works where the truck already stands still. On urban collection routes the natural windows are crew breaks, the transfer station leg and the mid-shift swap: typically 45 to 90 minutes. A 60 kW session across that window returns enough energy for a meaningful slice of the second loop. If the only window falls 20 minutes from the yard, the charger is useless. Map dwell first, then size the hardware.
Depot power capacity and load management
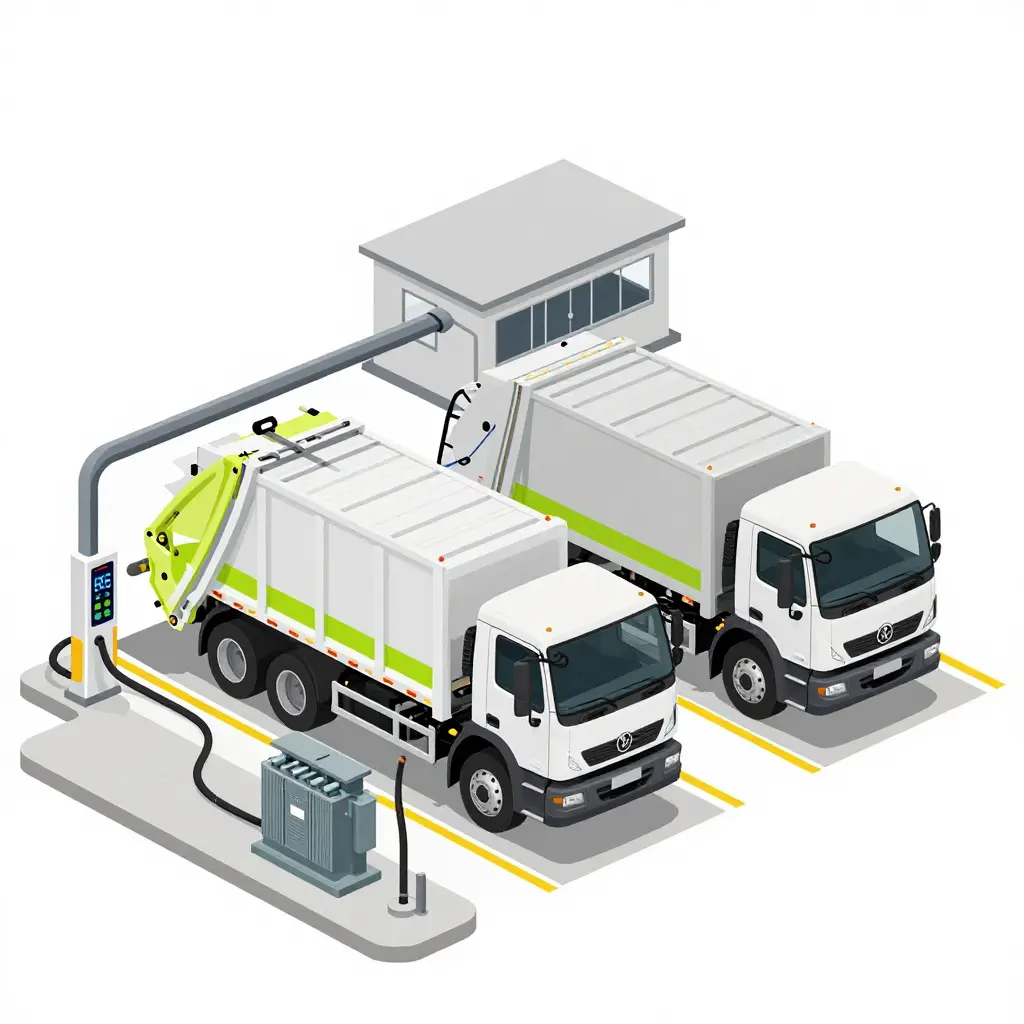
Six trucks plugged in at once at 120 kW each is a 720 kW site load, and most municipal yards cannot absorb that without a service upgrade. Load management, staggered charge starts and per-truck power allocation flatten the profile, cut demand charges and let you work within the existing transformer. Sequence the diesel-to-electric transition so the first trucks delivered are matched by the chargers already energised.
Sequencing to hold state of charge in band
Route order is a control variable. Front-loading the densest compaction work, keeping the longest transfer run inside the first half of the shift, and assigning the shallowest second loop to the truck with the lowest state of charge all keep the fleet inside its planned band. Energy per stop is not uniform, and the tonnage a body really packs changes what the truck spends per kilometre. Treat the plan as a loop that gets re-checked whenever telemetry drops a truck below 35 percent.
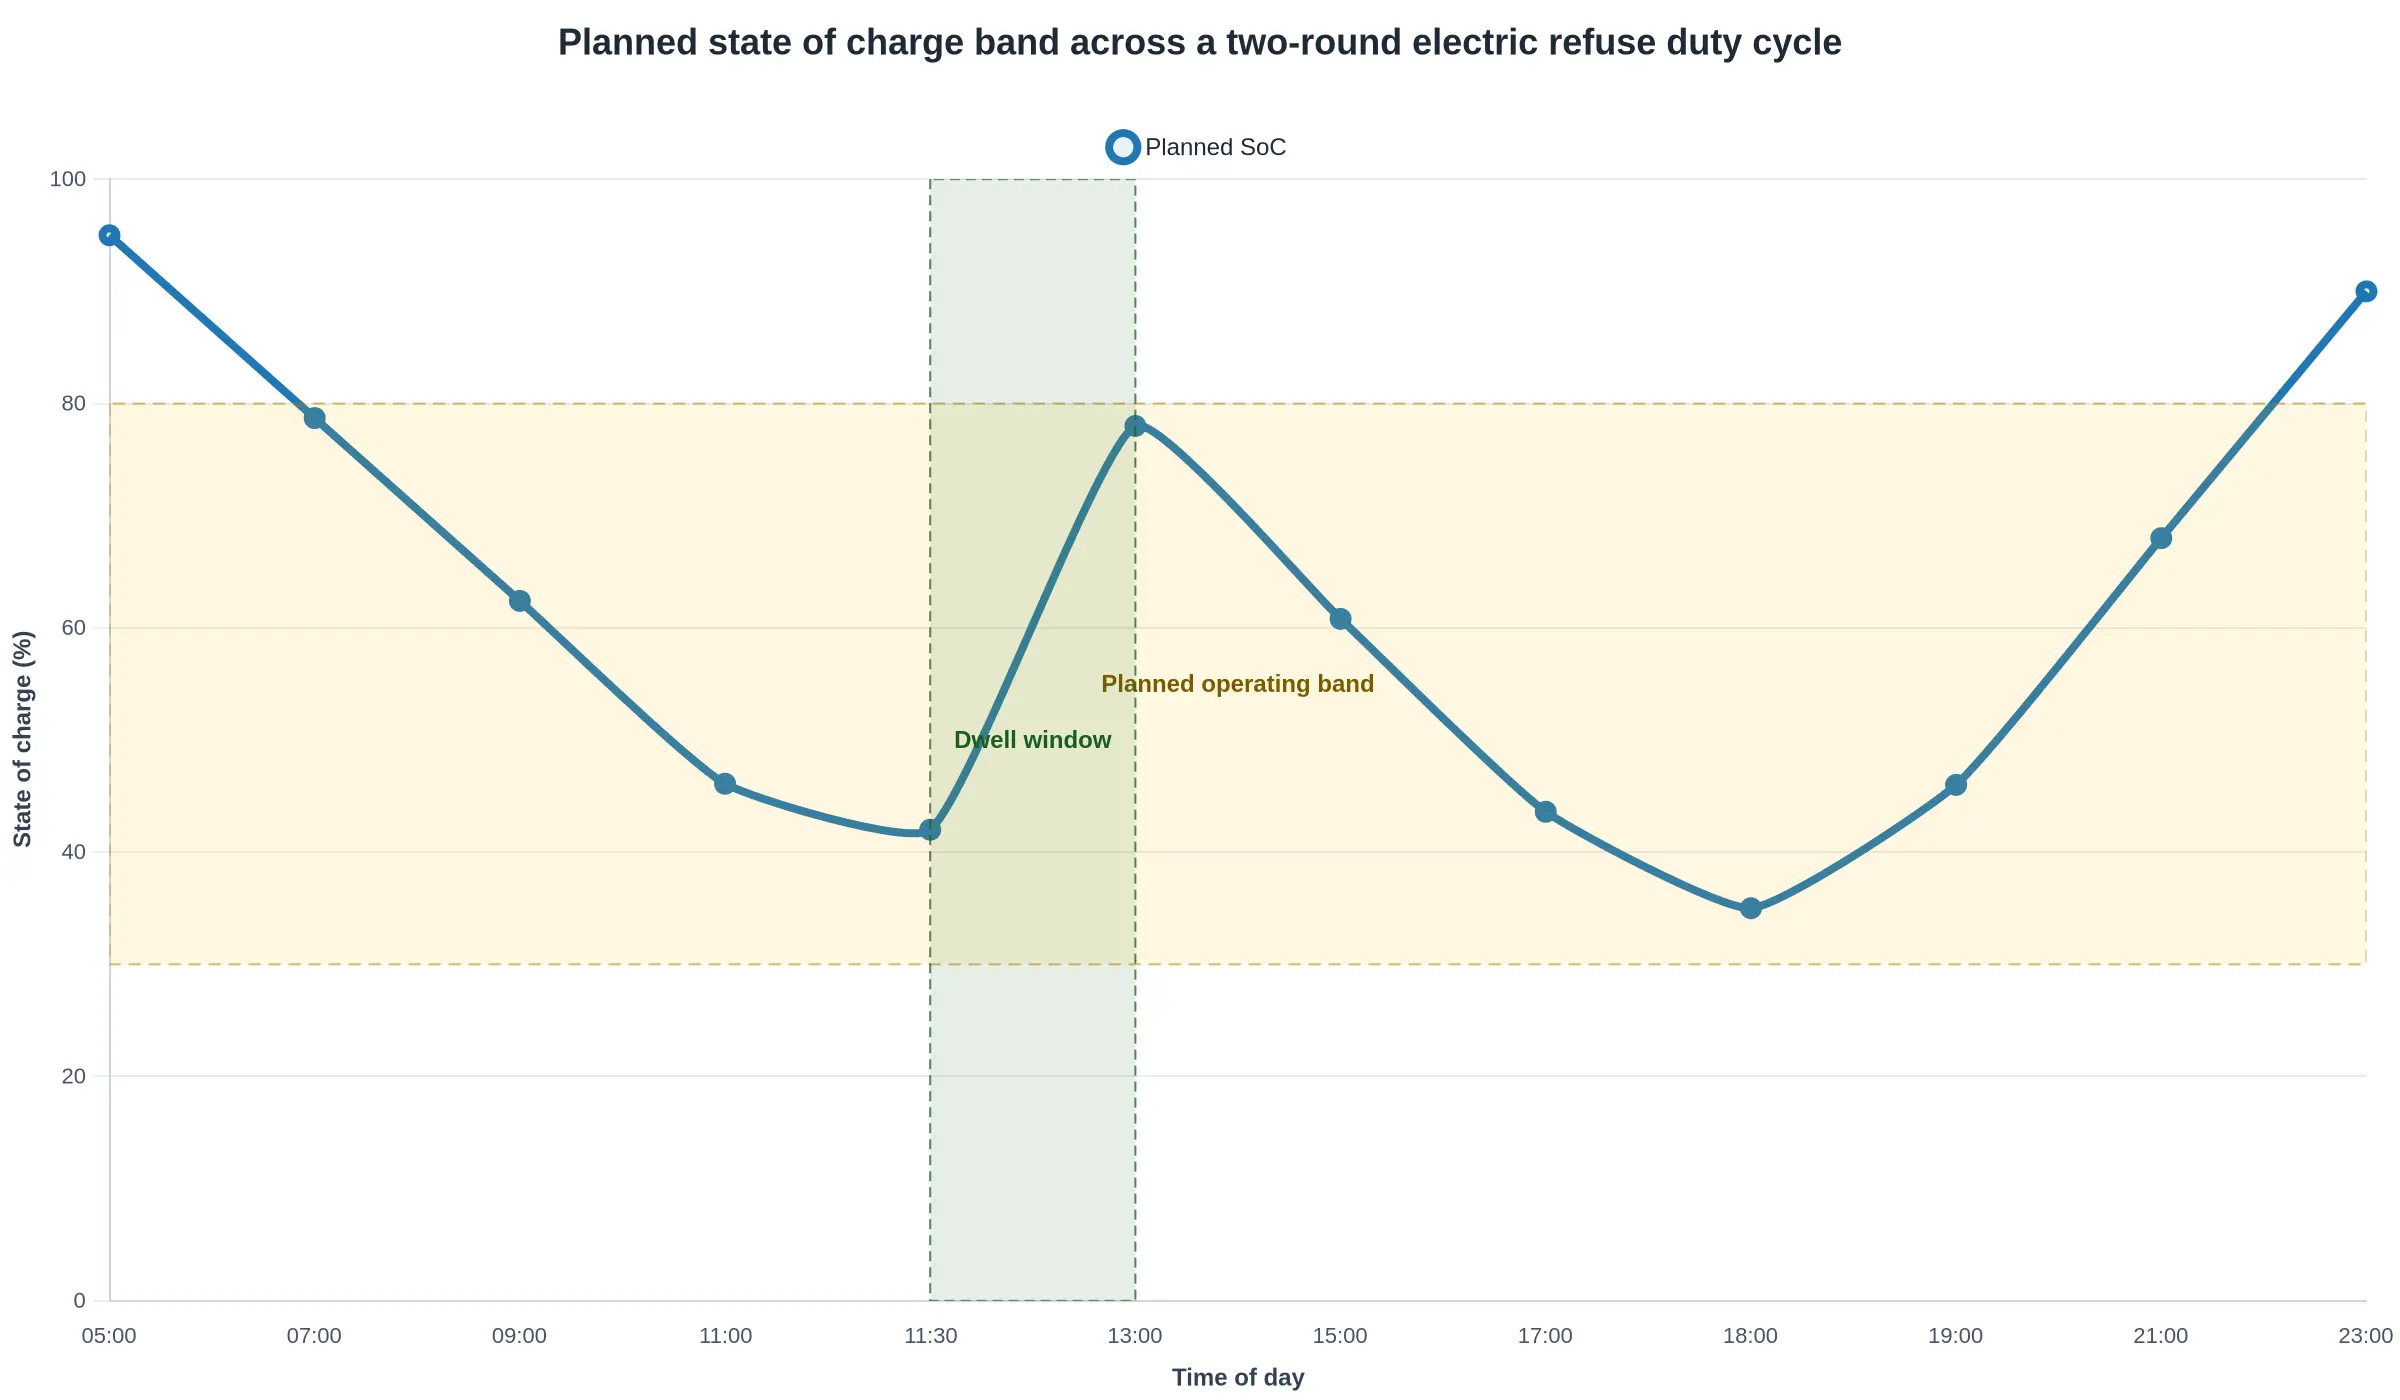
Above: a planned state of charge profile across two collection rounds, with the mid-shift dwell window used for a depot top-up and overnight charging back to a morning-ready level.
Four planning inputs before you commit a truck to a route
- Measured energy intensity: kWh per kilometre and kWh per tonne lifted from a two-week telemetry trial on the actual route, not a brochure figure.
- Verified usable capacity and depth of discharge policy: the number the BMS will actually release, with the supplier’s cycle-life position in writing.
- Confirmed dwell windows and charge power: yard and opportunity points, session length, and what each session really delivers after taper.
- Sequence-level load profile: stop density, transfer legs, gross weight per loop, idle time, and winter or air-conditioning penalties.
With those four documented, charging becomes a scheduling exercise of the kind route planners already handle.
The Swap Audit at a Glance: Five Gates, One Sequence
A swap audit should move through a fixed order of gates before any diesel tipper leaves the yard. The diagram shows the path a unit must clear before it is signed off for electric duty.
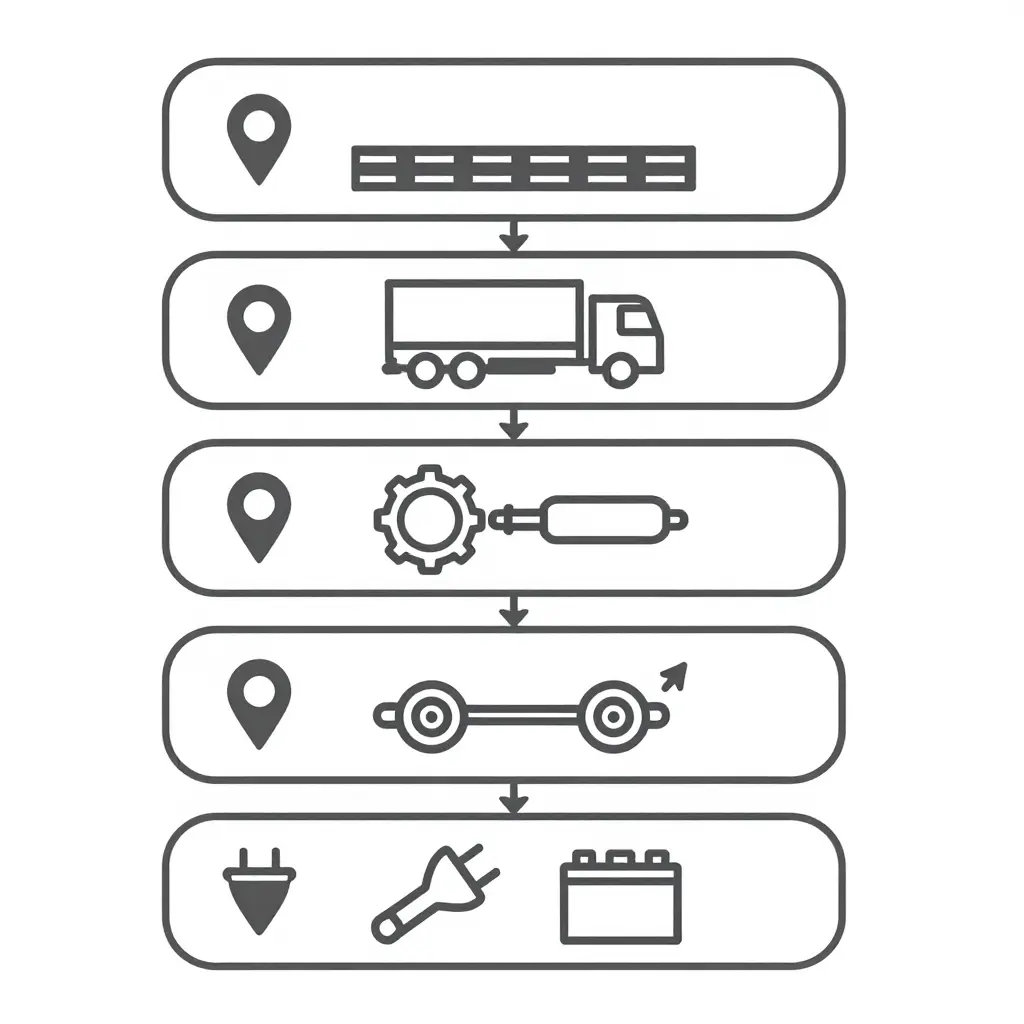
The first gate is the easiest to skip and the costliest to get wrong. Battery size and payload cannot be validated until the real route is known: stop density, grade, idle time at the tipping face, and the distance between the depot and the first collection point. Everything downstream inherits those numbers.
Conversions usually fail in the second and third boxes rather than on the battery. Chassis and body condition decide whether the existing structure can carry the new mass distribution, and drivetrain and hydraulic verification tests the old system’s pressure and duty-cycle assumptions against the new drive. The same logic applies to subframe and lift cylinder checks on any used unit before capital is committed.
Axle loading is worth confirming only after the mechanical and hydraulic picture is settled, and a charging plan only after axle load is confirmed. Infrastructure sized against a payload figure that later drops gets paid for twice.
Why the Order Matters
- Each gate consumes the output of the one above it, so skipping ahead produces numbers that look precise but are unfounded.
- Failures cluster in the middle of the sequence, not at the end – budget inspection time accordingly.
- The final sign-off is a decision record, not a formality: it should trace back to route data, measured axle loads, and a charging schedule you can defend in a procurement review.
Frequently Asked Questions: Electric Garbage Tippers in Real Fleet Service
How much payload does an electric garbage tipper typically give up versus diesel?
On a comparable 6×4 or 8×4 chassis, expect to lose roughly 1.5 to 2.5 tonnes of payload once the diesel engine, fuel tank and aftertreatment package give way to a 350-500 kWh battery pack. The penalty scales almost linearly with pack size, because the mass sits in the cells. As a share of the diesel payload that is roughly 10 to 25 percent, with the smaller figure on chassis that start from a larger payload base. LFP chemistry and a well-integrated body keep the loss near the bottom of that range, and trimming body steel recovers some of it. It also pays to know what actually fills first on a refuse body before assuming the lost tonne matters on your routes.
Is battery range sufficient for a full urban collection shift?
For dense stop-start collection work, usually yes. A typical urban shift covers 60 to 140 km with several hundred stops, and the pack sizes used in this class return roughly 140 to 200 km per charge on that duty. Regenerative braking is a genuine advantage here, recovering a meaningful share of the energy spent accelerating between bins. The caveat is that HVAC, compaction hydraulics and bin-lift cycles also draw from the pack, so range has to be validated against measured route energy rather than a brochure number.
What should we check first on a donor diesel body?
Start with the frame rails and body subframe, because an electric conversion concentrates battery mass in a way the original design may not have anticipated, and hidden cracks turn into fatigue failures quickly. Next, inspect the PTO-driven hydraulic system and the compaction mechanism: packer blade, hopper floor, hinge pins, and lift cylinders. If that mechanical side is worn out, electrifying it only makes the repair bill larger.
Can our existing workshop tooling service the electric drivetrain?
Mostly yes on the chassis and body side, no on the high-voltage side. Standard hydraulic, brake and mechanical tooling carries over unchanged, but you will need insulated tools, a CAT III/IV multimeter, HV-rated PPE and OEM diagnostic software before anyone touches the pack, inverter or motor. Documented HV safety and lockout/tagout training is non-negotiable, since insurers and OEMs both want proof of competence before a battery enclosure is opened.
How should we choose battery pack sizing for a specific route?
Log the real route for two weeks: distance, stop count, bin lifts per shift, gross tonnage, and ambient temperature range. Convert that into kWh per kilometre, then add a 20-30% buffer for pack degradation, cold-weather derating and accessory loads. Size the pack to the route rather than to the spec sheet, because an oversized pack taxes payload and purchase price while an undersized one costs uptime. Energy per tonne collected is usually a better planning metric than distance alone when scoping an electric garbage tipper for a diesel-to-electric transition.
Conclusion: Mass and Duty Cycle Set the Numbers, the Audit Sets the Outcome
Two findings frame the comparison.
The first is that range and payload are not separate specifications. Both come out of a single mass budget drawn against a specific duty cycle: every kilogram given to battery energy is a kilogram unavailable for collected waste, and every kilometre of route draws on the same pack. A route with long transfer distances, dense stop-start collection and grade changes consumes more per tonne than a flat urban loop of the same length. Specify battery capacity without the route profile, or body volume without a compaction ratio, and the figures look reasonable on paper and fail in service. Working back from route data is the order that holds: tonnage per shift, stops per kilometre and axle limits first; then body volume and compaction ratio, where compaction ratio determines body volume on a residential route; then payload and tare weight; battery capacity last.
The second finding is that a diesel-to-electric transition is decided component by component, before the order is placed. The powertrain changes, but the packer blade, hopper floor, hinge pins, frame rails, hydraulic circuit and lift mechanism stay, and each carries a mass penalty, a duty-cycle assumption or a wear pattern proven against diesel operation. A component-level audit establishes what the chassis is actually carrying, what can be removed, what must be reinforced, and what will wear early under electric torque delivery. Buyers who skip the audit learn those answers in the first year of service rather than on the specification sheet.
Specifying the Vehicle: CRRC
CRRC manufactures specialised vehicles for these duty cycles: tanker trucks, fire trucks, garbage trucks, sanitation vehicles, and trailers. Production runs under a documented quality management system, and export support covers technical documentation, spare parts, and after-sales service. Specification work starts from route data rather than from a catalogue figure. Buyers can state the required body volume, the front and rear axle ratings and the usable battery capacity they need, and set those values against distance per shift, stop density, grades and transfer trips. Where payload is the tighter constraint, understanding tare weight shows how empty vehicle mass is built up and where it can realistically be reduced.